
Download the Topic of Interest (PDF)
In this Topic of Interest white paper, we first briefly walk through the original small cap premium thesis and research that led to its industry-wide recognition. Forty years have passed since much of this analysis was conducted, so in this section we take a look at whether the small cap effect has remained statistically significant. Next, we discuss active management opportunities in small caps, as these businesses are smaller and less covered by analysts. Last, many U.S. companies are staying private for longer. We cover this trend and its implications for the small cap market, which is directly impacted by the private/public decisions of younger businesses.
Summary
In this Topic of Interest white paper, we first briefly walk through the original small cap premium thesis and research that led to its industry-wide recognition. Forty years have passed since much of this analysis was conducted, so in this section we take a look at whether the small cap effect has remained statistically significant. Next, we discuss active management opportunities in small caps, as these businesses are smaller and less covered by analysts. Small cap stocks may be a compelling ‘alpha’ play, even if an investor does not believe in a small cap premium¹. Last, many U.S. companies are staying private for longer, perhaps due to the increasingly heavy regulatory burden and scrutiny that comes along with being a public company, as well as relatively new legal incentives for private companies. In this section we cover this trend and its implications for the small cap market, which is directly impacted by the private/public decisions of younger businesses.
A brief history of the small cap premium
The original research and thesis around a small cap premium was based partly on the historical observation of the existence of such a premium, but was also based on compelling theoretical arguments for why this premium should remain salient over the long-term. Those theories included: smaller capitalization stocks attract less Wall Street analyst coverage (less information availability / liquidity); these stocks tend to be accompanied by greater cyclical and fundamental risks; and smaller companies have a higher failure rate (greater chance of business closure, which creates a sort of ‘default risk’ premium). In Rolf Banz’ groundbreaking paper of 1980² he proposes a theory for the existence of small stock relative outperformance, suggesting a lack of market data and therefore underinvestment in the smallest firms results in underpricing and a higher discount rate:
“One possible explanation involving the size of the firm directly is based on a model by Klein and Bawa (1977). They find that if insufficient information is available about a subset of securities, investors will not hold these securities because of estimation risk, i.e., uncertainty about the true parameters of the return distribution. If investors differ in the amount of information available, they will limit their diversification to different subsets of all securities in the market. It is likely that the amount of information generated is related to the size of the firm. Therefore, many investors would not desire to hold the common stock of very small firms.”
Other experts on the topic have suggested alternative interpretations, such as the theory that smaller firms more frequently experience distress and are more financially levered, which creates greater sensitivity to market movements. This tends to generate a unique risk premium that is compensated through time (Chan and Chen, 1991)3. In 1992 Eugene Fama and Kenneth French published “The Cross-Section of Expected Stock Returns” which led to more widespread recognition of the small cap premium. In this paper the authors reviewed a variety of literature and theories regarding small cap stock outperformance, but did not hang their hat on any single particular theory:
“Banz (1981) documents a strong negative relation between average return and firm size. Bhandari (1988) finds that average return is positively related to leverage…Chan, Chen, and Hsieh (1985) argue that the relation between size and average return proxies for a more fundamental relation between expected returns and economic risk factors. Their most powerful factor in explaining the size effect is the difference between monthly returns on low- and high-grade corporate bonds, which in principle captures a kind of default risk in returns that is priced.”
Has the small cap premium been statistically significant since 1980?
As mentioned above, much of the small cap thesis was fueled by the fact that smaller companies had delivered such exceptional outperformance (relative to large cap companies) during the prior fifty or so years. If this outperformance had never occurred, it is very unlikely that the idea of a small cap premium would ever have gained prominence. So, that leads us to the question of whether small cap relative outperformance has held up since the original research of Banz in 1981. Below we take a look at cumulative performance. The small cap premium is defined in this paper using the Fama French construction, by dividing a stock universe into two portfolios―one portfolio of the 10% smallest stocks in a universe and one portfolio of the remaining 90% largest stocks in a universe4. Performance of the small cap premium is the performance of the small stock portfolio minus the performance of the large stock portfolio.
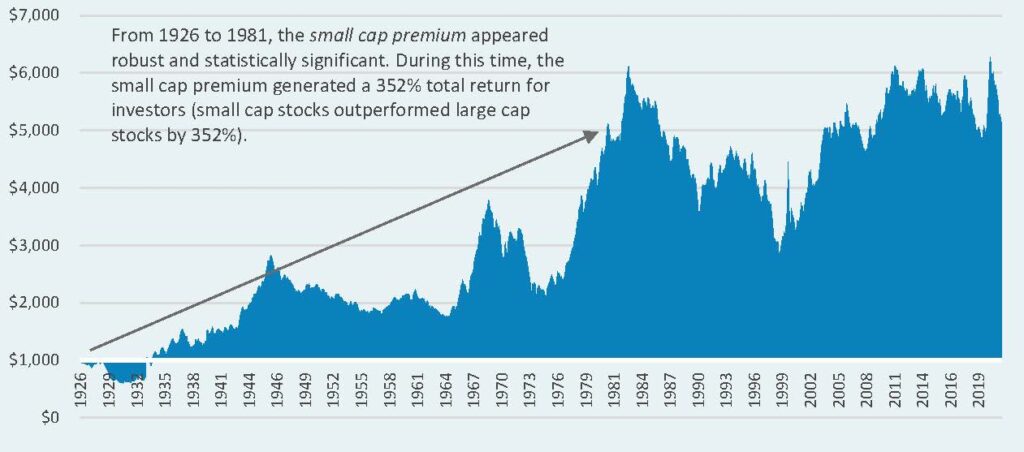
Since 1926: Small cap premium (growth of $1,000)
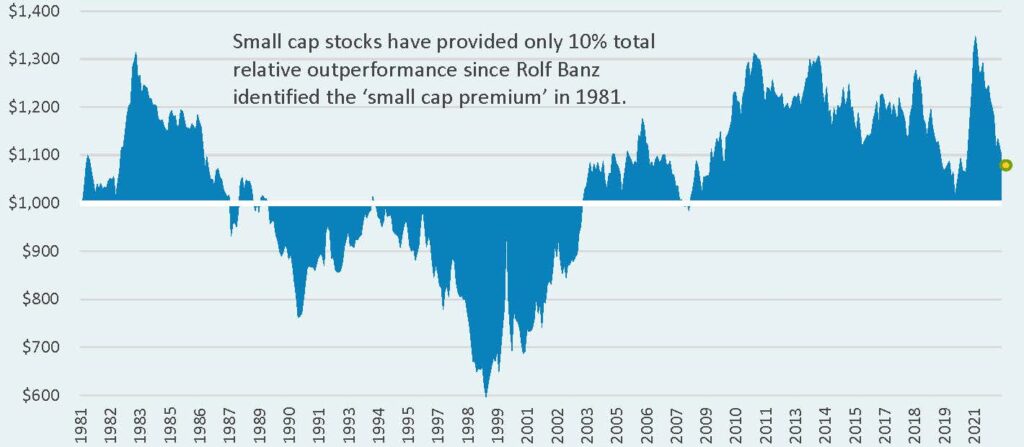
Since 1981: Small cap premium (growth of $1,000)
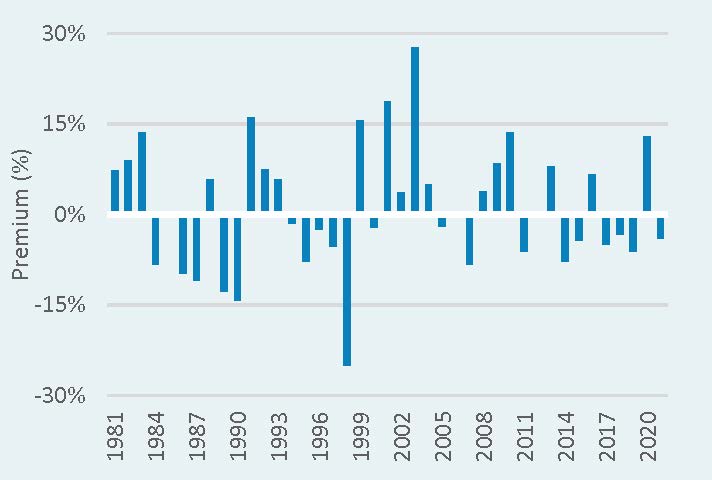
Calendar year small cap premium
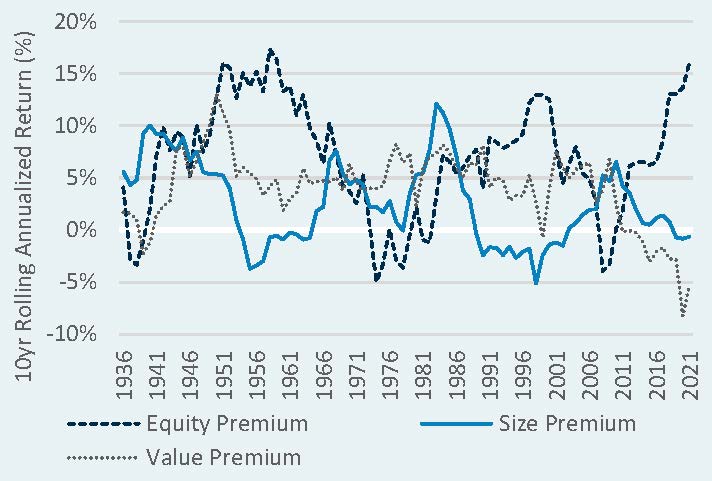
10-year rolling annualized return
In examining these data we quickly notice a stark difference between the performance of small cap stocks leading up to 1981, and performance from 1981 to current day. Up until 1981, a long-term investor in these smaller companies would have attained fantastic outperformance relative to larger companies. However, since 1981 this relative performance has been volatile, fluctuating between small cap underperformance and small cap outperformance. In statistical terms, the small cap premium was highly significant from 1926 to 1981, to nearly a 99% confidence level. There were only 1 in 100 odds of these strong returns occurring by chance (p-value of 1.2%, to be specific). On the other hand, from 1982 to April of 2022, the small cap premium was very far from being statistically significant. There were 1 in 3 odds that the slim small cap relative outperformance that occurred during this period was coincidental (p-value of 33.8%).
Now, what does all of this suggest? From a purely statistical standpoint, the past 40 years of small cap behavior casts doubt on the existence of a small cap premium. It may be possible that some of the fundamental characteristics of small cap companies have changed over years, leading to a diminished small cap premium. Improved analyst coverage, financial transparency, and trading liquidity, for example, could be to blame (though as we discuss in the next section, these attributes remain much weaker than large cap stocks). It is also a small possibility that the small cap premium was a market anomaly all along, despite the robust statistical evidence and thorough research of Rolf Banz, Eugene Fama, Kenneth French, and other contributors to this market discovery in the 1980s and 1990s. As demonstrated in the ten-year rolling performance chart above, the small cap premium does appear to have historically been the weakest factor of Fama & French’s Three Factor Model.
Active management in small caps
We believe that focusing too much on the topic of a small cap premium, which is a beta topic, may lead investors to miss out on the bigger picture. Active manager outperformance can have just as large (or larger) of an impact on the returns of small companies relative to large companies. Smaller companies tend to be less covered by analysts, less liquid, and provide a broader opportunity set. These qualities have historically translated to a more fertile hunting ground for alpha, relative to the large cap space. When discussing the past, and potential future, value added from active management, we believe it is helpful to identify the two underlying drivers of this return: active risk (tracking error), and information ratio. These two components can be framed within our broader Investment Golden Rule formula, as shown below, which draws on foundational market concepts such as the capital asset pricing model.
‘Investment Golden Rule’ formula
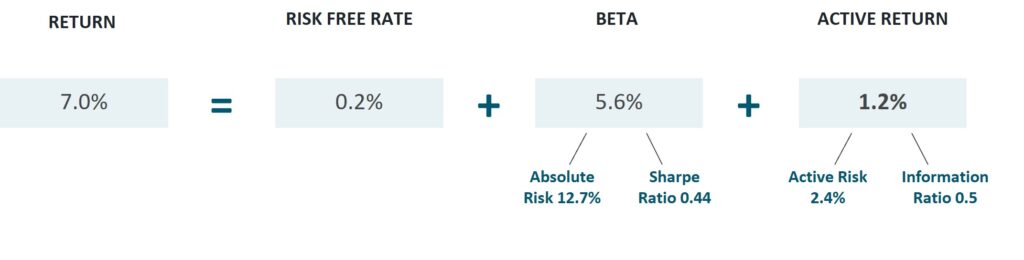
Active risk is a measure of how differentthrough time an active manager’s performance is from the benchmark. Active risk is necessary for a manager to add value, because a manager needs to take bets relative to their benchmark to generate performance that is different from that of the benchmark.
Information ratio measures how much the active manager is compensated for each unit of active risk. For example, a manager with an information ratio of 0.5 has achieved 0.5% of added return above the benchmark return, for each 1% of active risk.
Multiplying an active manager’s information ratio by that manager’s active risk gives us the manager’s active return (the return above and beyond the benchmark).
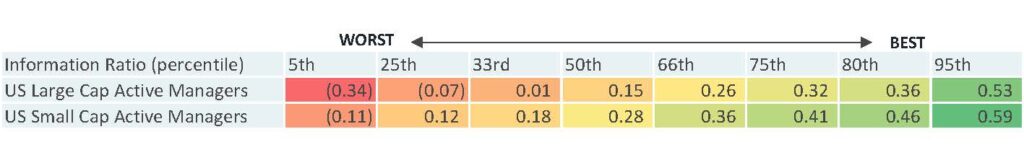
These metrics can be used to illustrate the historical success of active managers in the large cap stock space, and the small cap stock space. This is shown below across a few percentile rankings. The 5th percentile ranking corresponds to the fifth worst active manager out of every 100 active managers. The 95th percentile ranking corresponds to the fifth best active manager out of every 100 active managers. The same rankings are applied to active risk (for this table the color coding is applied for visual effect, as we are not meaning to imply that maximizing active risk is necessarily a good idea).
20-year historical information ratio
20-year historical active risk (tracking error)
In these tables we observe that small cap active managers have been more successful at generating outperformance for investors, on average. The average (50th percentile) active manager in the small cap space has added nearly double the outperformance for each unit of risk (tracking error) relative to the average large cap active manager (information ratio of 0.28 versus 0.15). Small cap managers also exhibit materially higher tracking error―perhaps testament to the broader opportunity set of stocks available in which to invest.
One caveat worth mentioning is that active management performance above is displayed gross of management fees. The fees an investor pays their active manager(s) will bring down all of the information ratio figures above, though perhaps a bit more for small cap managers as fees in this space are often higher. Additionally, trading and other frictional costs tend to be greater in small cap stocks due to less liquidity.
Concerns around companies staying private longer
There is a strong marketplace trend towards businesses staying private for longer. Instead of going public early in the growth stage, many businesses are using private funding to scale and then go public at a much later business stage (at a much larger business size), or even choosing to stay private altogether. This has obvious implications for public small cap investing, as small cap investors do not profit from the growth of private companies, and miss out on the gains of companies that eventually go public in the form of large cap stocks (i.e., skip the small cap stage). However, we have observed certain small cap managers dipping into pre-IPO private companies in specific situations—in an effort to gain access to the value-creation process.
Median age of companies that go public (IPO)5
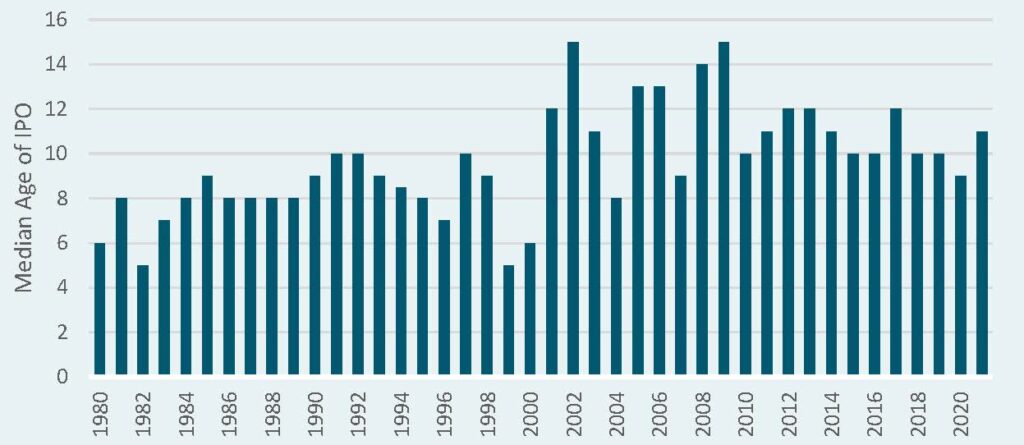
It is difficult to know for certain why so many businesses are choosing to stay private for longer. Many pundits have pointed towards government-imposed regulations and heightened scrutiny that has created heavier costs and burdens for public companies, such as the Sarbanes-Oxley Act of 2002 and increasingly extensive ESG reporting requirements. Others have pointed towards the short-termism of Wall Street analysts which can run counter to the long-term interests of companies. Additionally, other regulations have increased the incentives for staying private, such as the Jumpstart Our Business Startups (JOBS) Act of 2012. This law loosened funding requirements for small companies and startups by eliminating the need to register with the Securities Exchange Commission in many cases. Over the past decade, a surge of capital from both venture capitalists and traditional small cap managers has enabled private companies to reach unprecedented sizes. Since 2014, the number of private mega fundraising rounds has ballooned.
Although the effects of this trend are difficult to quantify, it may serve investors well to be aware of them. As companies are staying private longer, the value creation process is effectively being moved from the public markets to the private markets, which has knock-on effects for small cap investors.
Conclusions
In this Topic of Interest white paper, we walked through the original small cap premium thesis and research that led to its industry-wide recognition. Forty years have passed since much of this analysis was conducted, and the small cap premium has not been statistically significant since that time, according to our analysis. However, in the next section we discussed the role of active management and the possibilities for active managers to generate value for investors. We believe that active management opportunities in this space are often overlooked, and may justify investment even if the small cap premium is greatly diminished or nonexistent in the future. Last, many U.S. companies are staying private for longer, perhaps due to the increasingly heavy regulatory burden and scrutiny that comes along with being a public company, as well as recent legal incentives for staying private. We believe investors should stay apprised of this trend, as high-growth companies more frequently are waiting until a later-stage in their growth cycle to go public, which has secondary effects for small cap investors. Please reach out to your Verus consultant to discuss these trends and additional thoughts around small cap investing.
1 The idea of a ‘small cap premium’ is a beta consideration, since a small cap premium exists only if the entire market of small cap stocks (the ‘beta’) outperforms large cap stocks over the long-term. Investors who do not believe in this ‘beta’ outperformance may still find small cap stocks attractive if active managers can be selected to add value (‘alpha’).
2 Banz, R. (1980). “The Relationship Between Return and Market Value of Common Stocks”, 17. Retrieved from https://business.unr.edu/faculty/liuc/files/BADM742/Banz_sizeeffect_1980.pdf
3 Chan & Chen (1991). “Structural and Return Characteristics of Small and Large Firms”, 1. Retrieved from https://www.jstor.org/stable/2328867
4 Fama & French also further subdivide these two large and small portfolios into value and growth. For the granular details of construction please see the Kenneth French Data Library: https://mba.tuck.dartmouth.edu/pages/faculty/ken.french/data_library.html
5 Ritter, J. (2022). “Initial Public Offerings: Median Age of IPOs Through 2021”, 3. Retrieved from https://site.warrington.ufl.edu/ritter/files/IPOs-Age.pdf