
Download the Topic of Interest (PDF)
As consultants, we are often asked “how can we support a strategic asset allocation with an expected return (ER) that is different from the actuarial assumed rate of return (AARR)?” We believe Plan sponsors with a gap between these two metrics should work to bring the ER and AARR in line. Boards may face modest differences for three distinct reasons – each have countervailing reasons for closing the gap they cause. First, it might be argued that these forecasts are built for different purposes. Second, there is variability in ER forecasts as markets fluctuate year-to-year. Third, the timeframe over which the forecasts are used differs.
In this paper, we further explain this reasoning and conclude by offering approaches for Plans to reduce any mismatch between ER and AARR to a reasonable level, which we generally believe to be less than 0.5%.
Introduction
The “expected return” (ER) is a market forecast created by the investment consultant, which is based on current market conditions and pricing. This forecast, often referred to as a capital market assumption, is used to help Plan trustees select an asset allocation based on the risk tolerance of the plan and the expected return of each asset class. The “actuarial assumed rate of return” (AARR) is created by the actuary using a combination of professional judgment, consideration of assumed return impact on Plan liabilities and costs, and awareness of practitioner capital market assumptions. The AARR is used to discount a stream of liabilities for the purpose of determining funded status and contribution rates. This rate of return directly impacts liabilities and costs.
A typical range of returns used by institutional investors for each metric (ER and AARR) suggests a meaningful gap between the two is common, and this gap has increased over the past decade or so. As historically low interest rates and expensive assets have led to materially lower return forecasts, the ER for a diversified 60/40 stock and bond portfolio has been in the 5-6.5% range, or even lower. Meanwhile, the AARR has followed, but only very slowly as lowering this return can involve significant knock-on effects, such as funded ratio and contribution volatility. It is normal to see this figure in the 6.0-7.5% range (according to NASRA, the current average AARR is 7.0%¹).
We believe Plan sponsors with a gap between these two metrics should work to bring the ER and AARR in line. Boards may face modest differences for three distinct reasons described in this Topic of Interest white paper – each of these potential reasons for difference also have countervailing reasons for closing the gap they cause.
- First, it might be argued that these forecasts are built for different purposes. The ER is used to help determine a reasonable asset allocation reflective of a pre-determined risk tolerance, while the AARR is used to discount a stream of liabilities for the purpose of determining funded status and contribution rates. However, it should be noted these forecasts ultimately focus on one shared goal—to pay the benefits of beneficiaries. If ER is lower than AARR, this suggests an accumulation of unfunded liabilities and brings into question the Plan’s ability to pay those benefits.
- Second, there is variability in ER forecasts as markets fluctuate year-to-year, and since different methodologies are used in producing these forecasts. However, those changes simply reflect changes in the environment, so the forecasting process should still be taken seriously, as it is a key component of Plan management.
- Third, the timeframe over which the forecasts are used differs. We typically forecast 10 years out for the purpose of evaluating various alternative allocation mixes (where the ER is focused), while the lives of most Plans (more the focus of the AARR) are expected to last into perpetuity. In this paper, we further explain this reasoning and conclude by offering approaches for Plans to reduce any mismatch between ER and AARR to a reasonable level, which we generally believe to be less than 0.5%.
Purpose
Let’s start by providing context regarding the nature of the ER and the AARR, the role of each in the investment process, and which party traditionally calculates each figure.
Figure 1: Summary of purpose
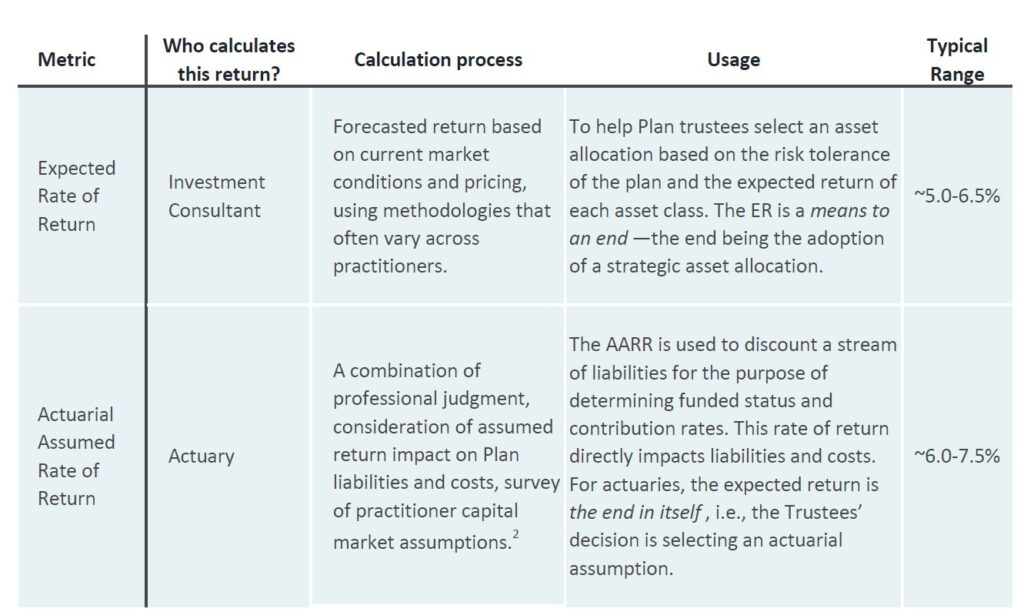
Some argue that these measures are used for different purposes. The ER is used to help determine a reasonable asset allocation for a particular goal reflective of a pre-determined risk tolerance. The AARR is used to discount a stream of liabilities for the purpose of determining funded status and contribution rates. The former is used as an input into an evaluation with given constraints to help the Board arrive at a reasonable asset allocation. In other words, it is a means to an end. The latter is the result of Board deliberation that takes into account a variety of factors, all of which are considered in light of the Board’s fiduciary duty to plan participants. In other words, it is an end in itself. However, these forecasts ultimately focus on one shared goal—to pay the benefits of beneficiaries. If ER is lower than AARR, this suggests an accumulation of unfunded liabilities and brings into question the Plan’s ability to pay those benefits.
As described above, the typical range of returns used for each metric is different, and this difference has increased over the past decade or so. Low interest rates and generally expensive assets have led market participants to reduce their ER forecasts, while AARR have followed, but very slowly. We expect that the market selloff of 2022, which has led to more attractive asset pricing and higher interest rates, will generally lift ER and help close this divide to some degree.
Variability in forecasts
There is variability in ER forecasts as markets fluctuate year-to-year. This is by design, since these forecasts are meant to capture market movements and the impacts of those market movements on the likely future performance of the portfolio. Also, different methodologies across firms are used in producing those forecasts. This compares to the AARR, where within the actuarial community debates exist regarding the degree to which assumptions should be market-sensitive or stickier and focused on a longer horizon3.
It may be tempting for an investor at this point in the conversation to lean on the mindset that most forecasts will turn out to be wrong anyways, so why care too much about a gap between ER and AARR? We think that this is an unhelpful perspective to take. Everyday life is full of forecasts; however, uncertainty does not mean that a casual approach to forecasting is appropriate. In fact, uncertainty may suggest a greater level of care and diligence is needed (and perhaps a bit of conservatism). For example, most readers of this document use their smartphone for navigation and managing traffic. Let’s say a reader of this document has an important appointment, and their smartphone tells them it will take 52 minutes to drive there with traffic. In this situation, would we throw up our hands and tell ourselves it doesn’t really matter when we start driving because the smartphone estimate is probably wrong? Likely not―instead, we would give ourselves 52 minutes for the drive (or maybe even leave a bit earlier just to be safe). Most smartphone users trust the traffic estimate because these estimates tend to be correct, on average. In other words, forecasts that are not biased, even if they are rarely exactly correct, are useful (“biased” in this case meaning consistently too high or too low).
The role of an investment consultant is to be an unbiased arbiter of how capital markets are likely to perform in the future. As mentioned, market forecasts involve uncertainty and will rarely turn out exactly correct. However, the ER provides an unbiased market-sensitive forecast of the future, and is a key component to asset allocation and the ongoing management of a portfolio. Similar to our example above, we believe that it is healthy for investors to both embrace the uncertainty involved in market forecasting, and trust ER as a necessary aspect of managing portfolios.
Time horizon mismatch
Most market participants use a 10-year time horizon for forecasting ER because it is a shorter time period, which allows for greater accuracy in market forecasting. Longer forecast periods are typically not used for evaluating strategic asset allocations because informational value is lost for identifying opportunities for value-adding portfolio adjustments. The Plan’s liabilities, on the other hand, can be viewed over a much longer time period, whether one is talking about the operational life of the Plan or the duration of liabilities.
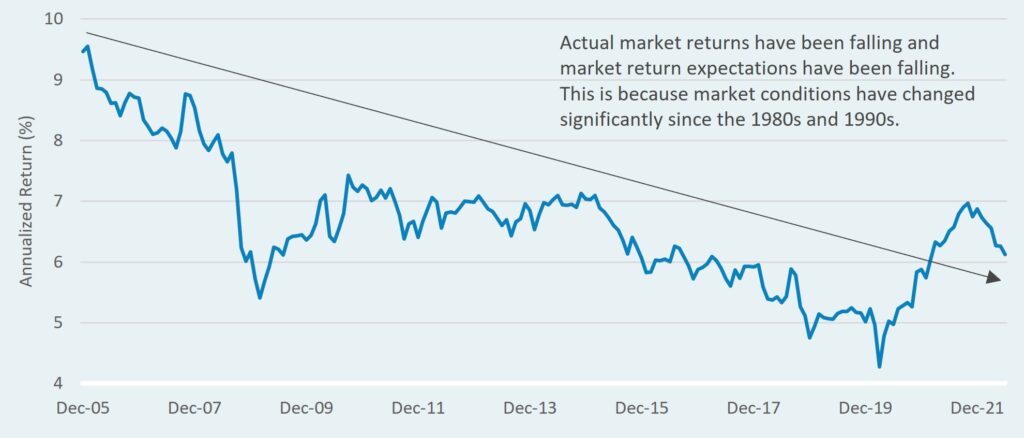
Many investors today appear to agree that the next 10 years of market returns will likely be low, but that the next 30 years will be much better. These investors often point to the high returns of the 1980s and 1990s as evidence that performance might again be strong in the future. However, for the next 30 years to deliver truly superb returns, market conditions would need to revert to those conditions that existed during the 1980s and 1990s, for example. Specifically, a return of 7%+ U.S. Treasury yields, excellent economic growth, higher inflation, a material expansion of equity valuations, etc. This is pretty far from current market and economist expectations, and would be a very aggressive forecast by most standards today. If instead an investor generally agrees with the current market consensus that inflation will be fairly low for the long-term (near 2% according to current market pricing and expectations of the average American household), that interest rates will stay relatively low (U.S. 10-year Treasury yield expected to stay near 3-3.5%), global economic growth to revert to a moderate rate, and risk asset valuations to stay around average levels of the past 20-30 years, these assumptions imply that 30-year capital market assumptions should likely be fairly similar to 10-year capital market assumptions.
In short, we should avoid the hopeful thinking that the market returns of the 1980s and 1990s could occur in the future, unless we are also forecasting a return of the market and economic conditions that existed during those decades. As shown below, portfolio returns have been steadily falling as falling interest rates and conditions broadly have led to a lower return outlook.
Figure 2: Historical 20-year rolling returns imply ‘lower for longer’
Closing the gap
If a Plan’s AARR is materially higher than the ER, this warrants further analysis and conversation. As a general rule, we believe a gap greater than 0.5% should be addressed, as some investors may reasonably tolerate small differences due to year-to-year fluctuations and other variables outlined in this paper. Specifically, investors should consider discussing solutions for closing this gap and the financial implications in the future if no action is taken. Unfortunately, there are no silver bullets to resolve a gap between the ER and AARR. Below, we offer broad alternatives when considering the problem:
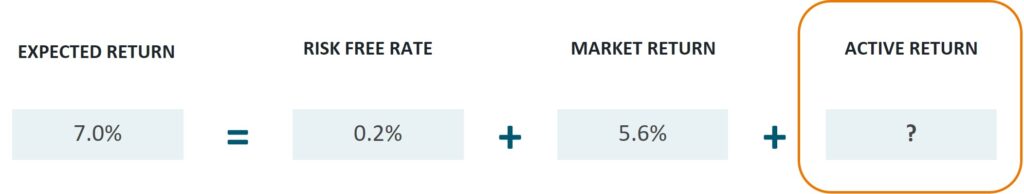
- Building net-of-fee active management return into Expected Return: The ER provided by a Plan’s investment consultant often contains market expected return but not the return expected from active management. If a Plan employs active managers in their portfolio but does not yet include expected active manager added value in these figures, this solution offers the dual benefit of adding to the robustness of the ER calculation, and also helping to close the gap between the AARR by pursuing a more holistic forecast of portfolio outcomes. Verus offers clients a robust method for estimating active return, using the tracking error characteristics of each client’s active managers and the broad historical success rate of active managers across each asset class universe (i.e., historical information ratio data).
Figure 3: Investment “Golden Rule” formula
- Change the asset allocation to increase expected rate of return: This is perhaps the most obvious solution for an investor who does not believe that their portfolio is going to generate an adequate return to meet the rate of return set by their actuary. This likely involves increasing the risk of the portfolio. Investors should remain keenly aware of their risk tolerance in considering this option.
- Employing leverage to pursue higher alpha and/or greater beta return: The thoughtful use of leverage in portfolios can be a useful tool for investors who wish to increase their expected return (ER). For example, ‘Portable Alpha’ programs may allow greater efficiency by focusing fees on more pure forms of active management, paired with low cost ‘beta’ exposure. These types of programs can allow an investor to seek higher alpha without materially increasing total market risk, or can allow for more cost-effective beta exposure, or whichever combination best fits the goals and risk tolerance of the Plan.
- Increasing exposure to private markets (liquidity risk): Depending on the risk tolerance of the Plan and ability to forego asset liquidity, an investor may determine increased private market exposure to be an attractive solution. For those seeking greater portfolio tracking error and alpha as a method for increasing ER, this approach may be a consideration.
- Lowering the actuarial assumed rate of return / increasing Plan contributions: This is a direct solution with current financial implications for the Plan. Actuarial rates of return have been very slow to come down in recent decades, despite much lower interest rates, expensive asset pricing, and general consensus in the investor community that diversified portfolios will likely produce future returns that are multiple percentage points below the historical average.
Conclusion
A typical range of returns used by institutional investors for ER and AARR suggests a meaningful gap between the two is common, and this gap has increased over the past decade or so. We believe that a mismatch between these two rates of return should be discussed and thoroughly understood, and that the most prudent solution for Plan sponsors is to identify methods to close the gap. If AARR is higher than the return an investment portfolio actually receives over time, the Plan will accumulate unfunded liabilities, which will defer the financial burden of maintaining a healthy Plan to future taxpayers and Plan participants. As a general rule, we believe Plans with a gap between ER and AARR greater than 0.5% should discuss solutions to close that gap, including: 1) Building active return forecasts into the Plan’s ER estimate, 2) Changing the Plan’s asset allocation to increase ER (though with a close eye on enterprise risk tolerance), 3) Employing leverage thoughtfully to pursue alpha and/or obtain beta exposure in a cost-effective way, 4) Increasing private markets exposure, granting greater active management potential but also higher liquidity risk, and 5) Lowering the AARR and/or increasing Plan contributions.
For more information regarding our views on actuarial assumed rate of return and how investors might close the gap between their expected return and actuarial assumed rate of return, please reach out to your Verus consultant.
1 NASRA. (March 2022) NASRA Issue Brief: Public Pension Plan Investment Return Assumptions. https://www.nasra.org/files/Issue%20Briefs/NASRAInvReturnAssumptBrief.pdf
2 Actuarial Standards of Practice (ASOP) No. 27 “makes it clear that the discount rate is not necessarily the same as an investment return assumption for assets held in a pension trust…Section 3.7 discusses the selection of a discount rate more broadly, notes that the actuary should consider the purpose of the measurement as a primary factor in choosing a discount rate…In some situations, the actuary might use an investment return assumption as a discount rate, but in other situations the actuary might use other estimates or observations”
3 Society of Actuaries. (2014). Report of the Blue Ribbon Panel on Public Pension Plan Funding. https://www.soa.org/499dec/globalassets/assets/files/newsroom/brp-report.pdf. As described by the Society of Actuaries (SOA), there appear to be two competing ‘funding principles’ on the topic: 1) the principle of ‘stable funding’, which suggests a stable AARR that should be focused on very long-term market expectations to reduce the volatility of plan sponsor contributions, and 2) the principle of ‘intergenerational equity’ which suggests that a Plan sponsor should use the best available market forecasts based on current conditions so that current contribution levels best reflect the needs of the Plan (and so that each ‘generation’ of pensioners pays for their fair share of benefits). Principle 1 likely results in a somewhat fixed AARR that does not fluctuate as much year-to-year, while Principle 2 likely results in a variable AARR that may fluctuate year-to-year as market conditions change.