
Download the full Topic of Interest (PDF)
Download the short summary (PDF)
Executive summary
What is the fundamental reason why investors should care about liquidity? In short, investors want to avoid being forced to sell high-returning assets that have fallen in value in order to pay for benefits, philanthropic spending, expenses, and cover capital calls for their private asset programs. For example, forced asset sales during the selloff of early 2020 effectively locked in market losses for investors with insufficient liquidity to weather that volatility.
In this Topic of Interest white paper, we will first touch on the different definitions of liquidity and illustrate how these relate to institutional portfolios. Second, we will examine those liquidity characteristics in times of market stress, the way in which illiquid assets often behave, and how that impacts investors. Lastly, we outline a tool that we have created and discuss how this can be used to assist clients with gauging the appropriate level of liquidity in their own portfolios. Overall, we believe investors should put much thought and care into portfolio liquidity decisions.
Defining liquidity for institutional investors
Liquidity is generally defined as the ability to sell an asset without materially impacting that asset’s price at a time when the investor must sell. There are three parts to that sentence which we believe nicely illustrate the definition of liquidity: First, the ability to sell assets(how quickly can an asset be sold for cash?) Second, without materially impacting that asset’s price(how large of a discount would an asset need to be sold for if it were sold quickly?) Third, at a time when the investor must sell(how much do an asset’s liquidity characteristics change during market stress?) In this section we briefly delve into each of these aspects of liquidity.
First, the amount of time it would take to sell an asset for cash is a raw measure of liquidity. Most institutional investors hold a small amount of cash on an ongoing basis to meet obligations, but need to sell investments in the portfolio to meet larger cash outflow needs. Many assets such as publicly traded stocks and bonds can be sold quickly for cash. Other assets such as those that are privately traded may require months, quarters, or even years to sell. This is often due to the lack of a robust marketplace, which means it takes time for a seller to find the right buyer. Then, extensive due diligence may be required for the buyer to gain comfort with the investment, including a lengthy legal process. It is very important to note that even for liquid assets, active managers may have the option to put up “redemption gates” that prevent investors from obtaining their funds in a timely manner. In other words, an investor must understand not only the liquidity of the underlying assets, but also any restrictions around accessing those assets.
Second, if an asset were to be sold quickly, how large of a price discount would be required to attract a buyer? If an asset can be sold quickly but only at a -20% discount, this reflects very poor liquidity. The most liquid assets under normal market conditions can be sold very quickly and very close to their market value, which is reflected in a tight bid-ask spread of the asset1.
Third, liquidity characteristics of an asset can vary drastically depending on market conditions. Certain assets may be easily sold quickly at a competitive price during normal market conditions, but may be difficult to sell at a competitive price during strained market conditions. This was apparent even in the U.S. Treasury market during early 2020, with Treasury Inflation-Protected Securities (TIPS) trading at surprisingly deep discounts during the market selloff2. Therefore, investors should take into account how variable an asset’s liquidity profile might be through time.
Pricing & asset class considerations when evaluating liquidity
Most institutions have ongoing liquidity requirements. But during market stress, liquidity increases in importance, as a lack of liquidity can create more serious problems that are deleterious to the long-term value of the portfolio. In this section we cover illiquidity issues during market stress, including: bid-ask spread widening, the tendency for credit to dry up at the same time that borrowers require that credit, problems caused by the appraisal-based pricing nature of private assets, and private market capital calls.
Bid-ask spreads widening
“Bid-ask spread” is the difference between the price at which an asset can be purchased and the price at which it can be sold in the open market. As explained, this is a key characteristic regarding the liquidity of an asset class. In times of market stress, imbalances between supply (sellers of the asset) and demand (buyers of the asset) may lead to a widening bid-ask spread. Also, higher market volatility and uncertainty may result in market makers demanding a wider bid-ask spread to compensate them for the higher risk inherent in the market.
Exhibit 1: Bid-ask spreads vs. VIX for S&P 500 stocks
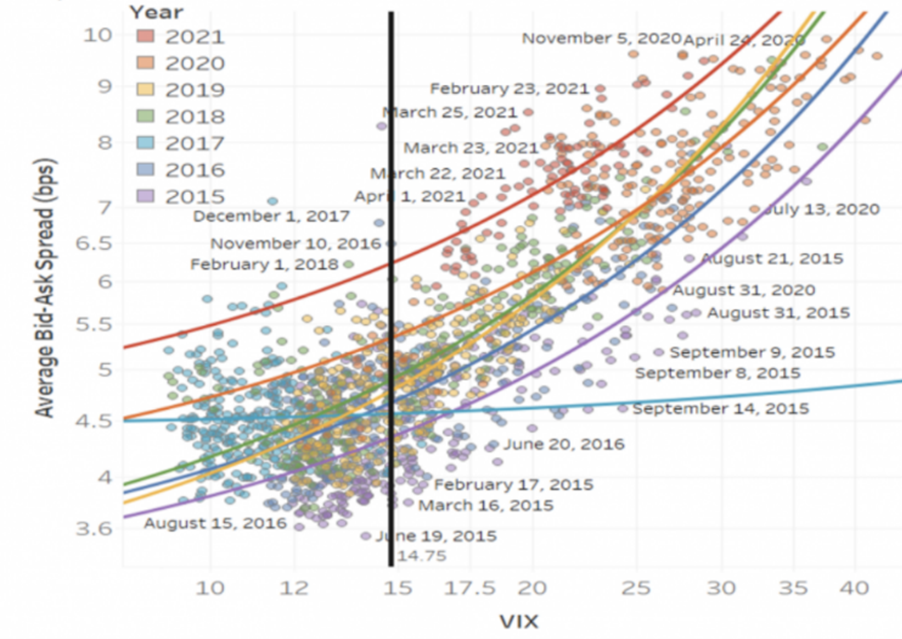
Note: From February 1st 2015 to April 30th 2021. Half trading days are excluded from the sample. Days where the average bid-ask spread were higher than 10 basis points have been removed from the sample
Shown in Exhibit 1 is an analysis performed by Nasdaq. This illustrates that during times of market volatility, bid-ask spreads are substantially wider.
Credit tends to dry up at the same time that borrowers need that credit
A common but unfortunate feature of economic and market stress is that the availability of credit often shrinks at the same time that the need for credit increases. As markets are stressed and credit is reduced, there is more demand to sell assets (to access cash) than to buy assets (to invest cash). This general theme may impact the portfolio in a variety of ways. Credit lines that investors and asset managers would normally have access to may be closed or restricted. Certain investment strategies―particularly private market and alternatives strategies―may exercise their ability to put up gates and stop investors from withdrawing their funds, often for an extended period of time. The credit that is available to investors may be more costly, with tighter borrowing covenants, and may only be available to higher-quality borrowers.
Problems with appraisal-based pricing
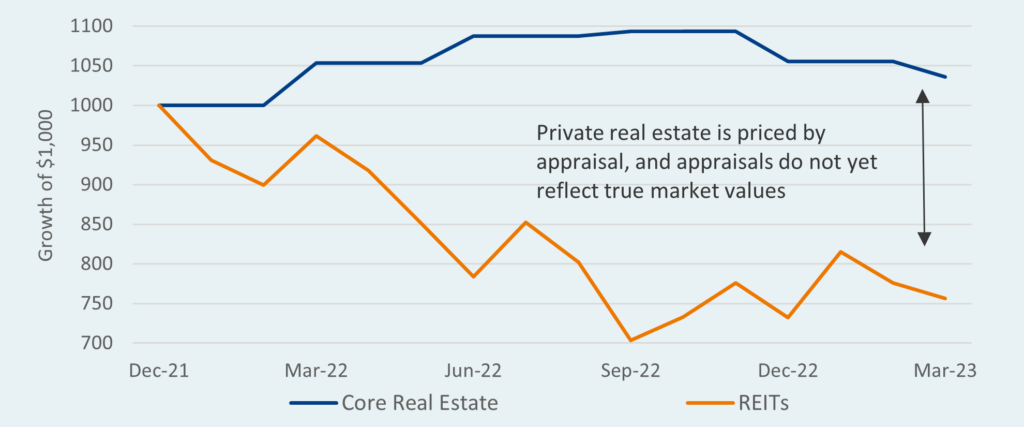
Private investment allocations in recent decades have become larger in institutional portfolios. A disadvantage of private assets is that the market value of these assets is not known through time because they are not publicly traded3, which can create complications regarding portfolio rebalancing. As illustrated in the chart below, private real estate has recently failed to reprice downward to the level where market transactions are occurring4. The overstated appraisal basis may increase the reported allocation of an investor’s total real estate portfolio above policy targets, which creates issues for investors because when rebalancing, they are only able to feasibly sell their publicly-traded real estate exposure (which is trading at a deep discount). Because only publicly-traded real estate can typically be quickly traded, and because publicly-traded real estate is trading closer to the true market price (much lower than private real estate), this makes rebalancing an unattractive proposition as it would involve locking in large market losses and also holding an outsized position to private real estate that conflicts with an investor’s investment policy targets.
Exhibit 2: Private vs. public real estate pricing
Capital calls for private assets
During a period of market stress it is typical for distributions to investors from their private asset managers to slow sharply, reducing the cash inflows that otherwise would have occurred. Private market capital calls often continue for two or three quarters to cover investments that private asset managers had already been planning. After a few quarters, these capital calls may stop, given the lack of opportunities in the market to put new money to work as transactions slow. This means that during the depths of a market drawdown it is likely that cash inflows to an investor from their private investments slow (or stop) while cash outflows continue for some time—dynamics that increase a portfolio’s illiquidity risk. This freezing of the market impacts the performance of private assets as holding periods are extended and borrowing costs increase.
Verus liquidity coverage tool
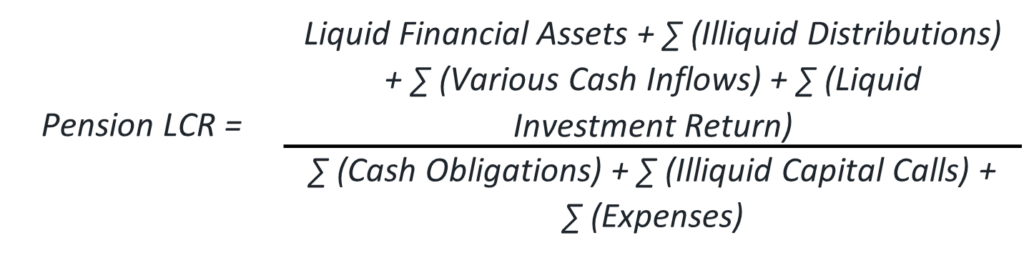
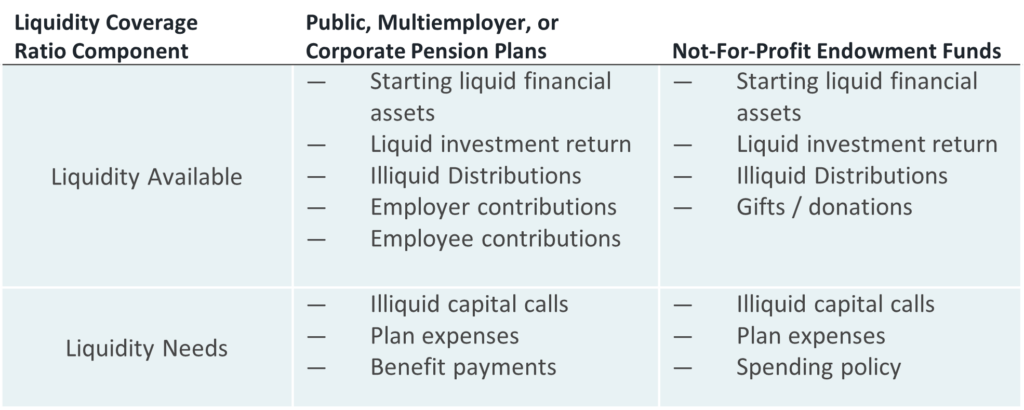
Most investors allocate to illiquid assets with the belief that they will be rewarded with higher returns. But how much liquidity should be retained in a portfolio? To evaluate the liquidity safety net that is available to an investor for any given asset allocation mix, we have employed a banking regulation-type framework to measure liquidity. In the Basel III accord, regulators defined the Liquidity Coverage Ratio (LCR) as the ratio of highly liquid financial assets relative to short term obligations. This formula has been modified and applied to institutional portfolios in order to capture the total liquidity available relative to liquidity needs5. Exhibit 3 below illustrates the LCR formula.
Exhibit 3: The liquidity coverage ratio

Exhibit 4: Generalized liquidity coverage ratio
The range shown in the Liquidity Coverage Ratio shown in Exhibit 5 represents the distribution of outcomes regarding the ability of cashflows over the time horizon to cover liquidity needs. The 50th percentile represents the expected outcome, or base case, and the distribution of outcomes around the base case represents what an investor might expect given a more positive outcome (higher LCR) or a more negative outcome (lower LCR). An LCR below 1 represents the expectation that the portfolio will have insufficient total liquidity over the next five-year period to cover cash obligations.
Exhibit 5: 5-year liquidity coverage ratio
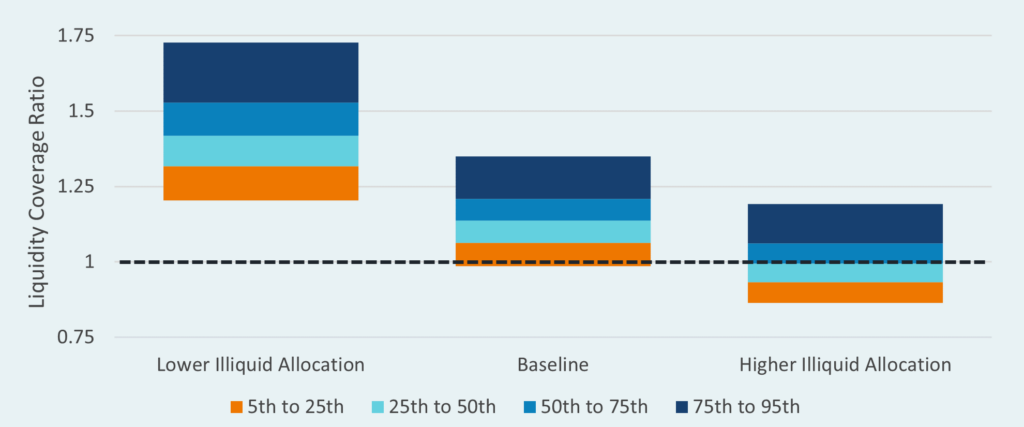
The ‘Low Illiquid Allocation’ portfolio mix in Exhibit 5, based on its liquidity profile, suggests there is an extremely low probability that liquidity will be insufficient to cover all cash needs. The ‘Baseline’ portfolio mix suggests a small but material chance that liquidity will not be sufficient to cover all cash needs. And the ‘High Illiquid Allocation’ portfolio mix suggests a substantial chance that liquidity will not be sufficient to cover cash needs.
An important note here is that there is not necessarily a single optimal liquidity coverage ratio―any decision around appropriate liquidity for the portfolio must be assessed by the investor, that investor’s objectives, and their tolerance for illiquidity.
Additional drivers of liquidity risk
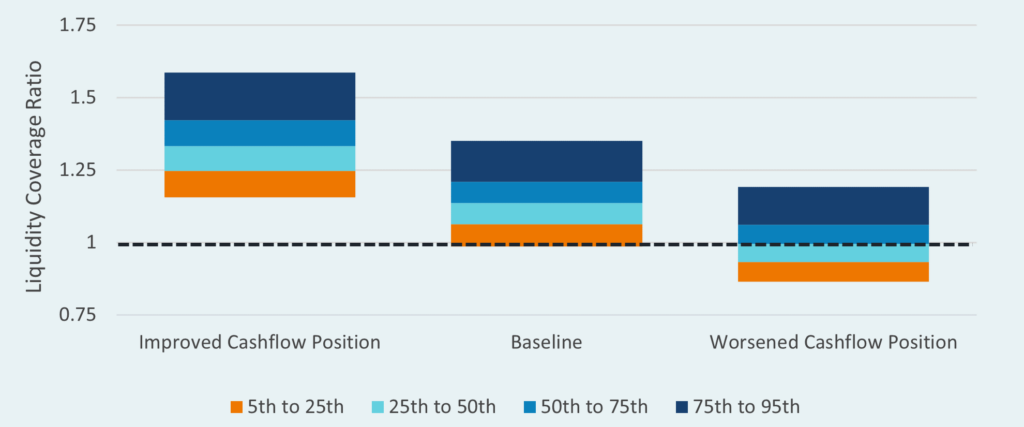
An investor’s specific cashflow profile is an important driver of liquidity risk and should be reflected as part of a liquidity assessment. An institution that expects higher liquid outflows (e.g., cash obligations and capital calls) or lower liquid inflows (e.g., contributions and distributions from illiquid assets) will have greater liquidity risk, all else equal. This is shown in Exhibit 6, where the asset allocation in each scenario is constant and only the cashflow position changes. Despite holding the same allocation, these three investors face materially different levels of liquidity risk.
Exhibit 6: 5-year liquidity coverage ratio
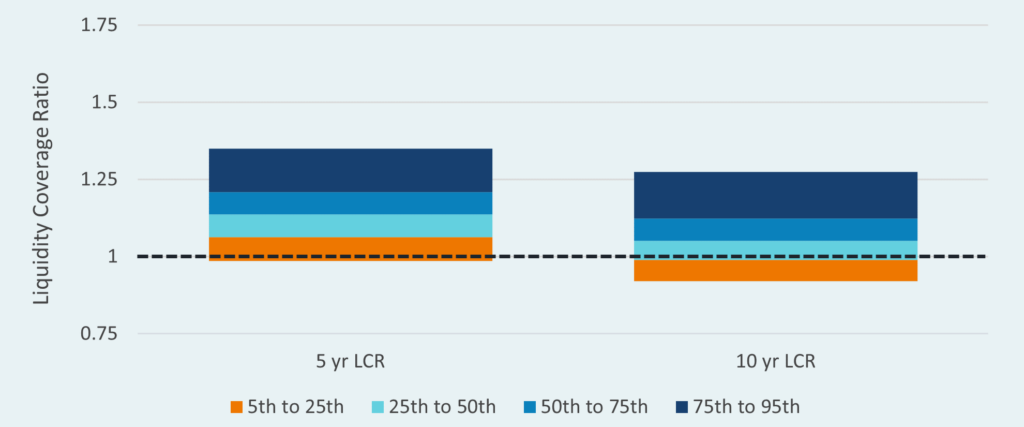
An assessment of liquidity risk is also impacted by the time horizon over which the analysis is done. This occurs because an institution’s cashflow profile may cause liquidity needs to evolve through time. For example, if liquid outflows exceed liquid inflows, the portfolio will tend to drift to a larger illiquid position through time. Furthermore, the longer the time horizon of the analysis, the more variability that is introduced from an asset return perspective. To capture these effects, the Verus Liquidity Coverage Tool calculates LCRs over a variety of time horizons. The illustration to the right shows how the same investor may appear to have low liquidity risk over a 5-year timeframe but has high liquidity risk when analyzed over a 10-year timeframe. Investors should analyze the liquidity risks over different time horizons, with a specific focus on the horizon that they believe is most relevant to their liquidity decisions.
Exhibit 7: 5- vs. 10-year liquidity coverage ratio
Additional considerations for deciding on appropriate portfolio liquidity
At this point the reader might be asking why an investor would ever choose an asset allocation mix with a substantial risk that liquidity will not be sufficient to cover cash obligations. However, many institutions may be comfortable with that risk. This is because investors should also take into account the repercussions for their portfolio in a situation where liquidity is insufficient for meeting obligations. If the investor has dependable external sources of liquidity, such as the ability to draw on a credit line or make a timely injection of cash, this investor may be more comfortable with greater illiquidity risk. On the other hand, if the investor has few or no outside options in the case that liquid assets are not adequate to cover obligations, this investor may want a greater liquidity buffer in the portfolio.
Conclusion/Recap
Most institutional investors are able to maintain a long-term focus regarding their return objectives. At the same time, even a very long-term investment horizon requires short-term cash flows to meet payment obligations, to meet capital calls for private asset exposures, and to periodically rebalance the portfolio. Investors must consider portfolio liquidity because they never want to be in a position where they are forced to sell their higher-returning assets that have just gone down in value in order to cover cash obligations or capital calls―effectively locking in market losses. Overall, we believe investors should put much thought and care into portfolio liquidity decisions. We have developed a tool using the Liquidity Coverage Ratio to assist clients in decision making regarding the appropriate liquidity safety net that they believe is prudent for their investment objectives. This tool provides an in-depth understanding of an investor’s liquidity profile and how that profile may be expected to evolve over time. For further information regarding our views on this topic, please reach out to your Verus consultants.
Appendix
Exhibit 8: Investor-specific liquidity coverage ratio
1. This concept can be illustrated by the “bid-ask spread” of an asset. The “bid” of an asset is the price that a broker is willing to purchase the asset from an investor. The “ask” of an asset is the price that a broker is willing to sell the asset to an investor. For the most liquid assets, the difference between “bid” price and “ask” price is very small.
2. The mispricing of U.S. TIPS was most widely publicized when the inflation breakeven rate of the TIPS market dropped to a level that appeared to be detached from reality, at one point pricing a 0.5% annualized inflation rate for the next decade, which was very different from other investor and household inflation expectations at the time. The illiquidity and therefore price discounts of the TIPS market was leading to an unusually depressed inflation breakeven rate during this period.
3. Some investors might argue that not having access to market price is an advantage rather than a disadvantage, because it reduces reported portfolio volatility. We are skeptical of this argument.
4. This is reflected in the extraordinarily large gap between the current average appraised price of private real estate relative to the average transaction price at which sales are occurring in the market.
5. In the Verus Topic of Interest white paper Strategic Liquidity authored by Danny Sullivan, this framework is described in deeper detail.