
Download the full Topic of Interest (PDF)
Download the short summary (PDF)
Executive summary
Is now a good time to engage in de-risking strategies? The combination of rising interest rates and relatively strong risk asset performance since 2020 seem to suggest so. In this paper, we aim to give plan sponsors a better appreciation of the potential benefits of de-risking strategies and examine when it would be most prudent to adopt these strategies. ERISA plan sponsors that have frozen benefits or report actuarial obligations with a market-based interest rate will find this paper most applicable to them.
Pension de-risking is any activity that a plan sponsor undertakes to narrow the range of potential future economic outcomes that may arise from the sponsor’s pension plan. De-risking takes many forms: changes to investment strategy, changes to plan provisions, or risk transfer solutions. This paper focuses on de-risking through liability-driven investment (LDI) strategies and addresses the impacts of risk transfer.
We begin by demonstrating the benefits of LDI strategies and how they can promote stability in plan funding levels. We look at how plan sponsors’ attitudes towards LDI might have changed with the current external environment, of which foremost is our belief that compared to years back, investors can now take less risk in portfolios while still meeting expected return targets. Lastly, we introduce a framework for evaluating de-risking decisions. In this discussion, we apply the framework to LDI and risk transfer approaches and illustrate how these might allow for “win-win” opportunities to reduce expected costs and risk.
Overview of liability-driven investing
Plan sponsors that report obligations on a mark-to-market basis will discover that changes in interest rates tend to be the biggest driver of change to actuarial liabilities. LDI strategies seek to mitigate this exposure by investing in fixed income assets that move in tandem with liabilities as interest rates rise or fall. We will refer to these fixed income asset classes as liability-hedging assets (LHA). Plan sponsors can measure the level of total plan interest rate risk exposure expected to be hedged by the assets by calculating the liability hedge ratio1. A plan sponsor with a 100% liability hedge ratio would not expect to experience any funded status impact from interest rates changes, as the impact on asset values and liabilities values would be equivalent2.
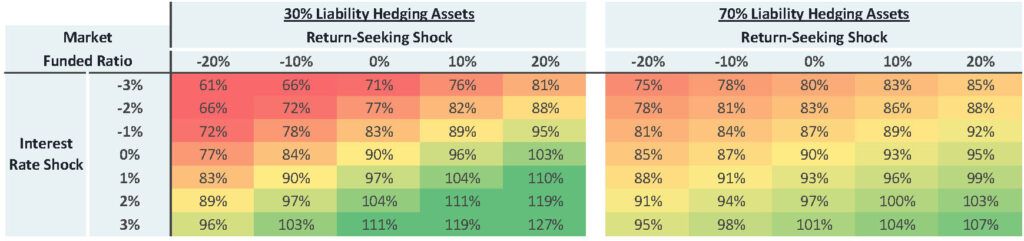
Increasing the allocation to liability-hedging assets narrows funded-ratio outcomes in two ways. First, larger liability hedging allocations increase the plan’s hedge ratio, therefore reducing exposure to future changes in interest rates. Second, the plan reduces its exposure to return-seeking asset classes, which tend to be uncorrelated with changes in liabilities. Exhibit 1 compares a portfolio with a 30% liability hedging allocation to one with a 70% liability hedging allocation. As you can see, the range of funded status outcomes narrows as we introduce shocks in return-seeking assets (vertical axis) and interest rates (horizontal axis)3.
Exhibit 1. Impact of increasing hedge ratio
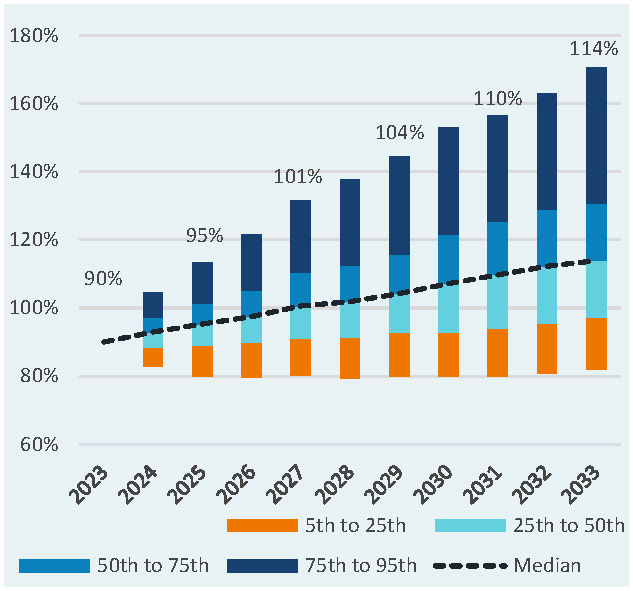
The cost of adopting an LDI strategy, in most cases, is a reduction in return expectations. This is illustrated in Exhibit 2, which compares the results of a 30% and 70% liability hedging portfolio, using a 10-year projection4. Shifting to a 70% liability hedging allocation, and achieving the narrowed funded status outcomes, results in an 11% reduction in the expected (median) funded status result from 114% to 103%, but with a narrower distribution of potential outcomes (meaning less risk of significantly missing the plan’s funding goal).
Exhibit 2. Expected impact of increasing hedge ratio
Funded ratio with 30% liability hedging
Funded ratio with 70% liability hedging
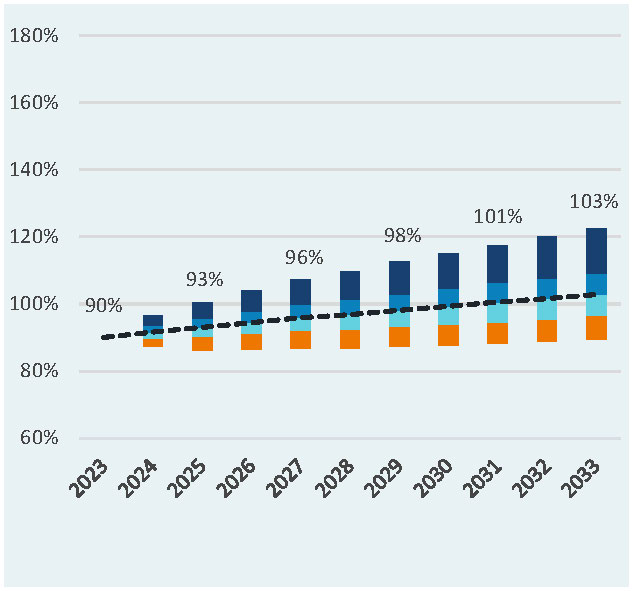
Source: Verus, stochastic forecast. For illustrative purposes only. The liability hedging portfolio is modeled with core plus fixed income. The return-seeking-portfolio is modeled assuming a typical corporate asset allocation mix of 41% domestic equity, 27% international equity, 7% private equity, 11% private credit, and 14% core real estate.
Traditional benefits of liability driven investing
By narrowing the range of funded ratio outcomes, LDI promotes financial stability in several ways. From an economic perspective, the increased predictability of funded ratios drives greater predictability in annual plan contributions and PBGC variable rate premiums5. LDI also helps promote stability from a financial reporting perspective. The reduced funded status volatility typically impacts the balance sheet where market-based funding levels are recognized, which also flows through to the income statement to enhance predictability of an organization’s financial performance. In addition, ERISA plan sponsors report financial results on Form 5500s, Annual Funding Notices, and PBGC 4010s, which may provide publicly available information even for non-publicly traded organizations6.
LDI strategies can create economic value for plan sponsors by taking advantage of asymmetric risk/reward tradeoffs that result from PBGC variable rate premiums and taxes on surplus assets. If a plan is fully funded, deterioration in the funded status triggers a PBGC variable rate premium that the sponsor otherwise would not incur. On the other hand, any funding improvements beyond fully funded status may largely be sacrificed in the form of taxes7. This creates incentives for plan sponsors to minimize funding volatility as full funding is approached.
Adopting LDI should result in increased alignment between investment cash flows and benefit payments. Receiving cash at the same time that benefits come due helps mitigate the risk of having to sell return-seeking assets at an inopportune time. This may allow sponsors adopting LDI to take on larger illiquid positions without necessarily increasing illiquidity risk.
How changes in the environment may impact attitudes towards de-risking
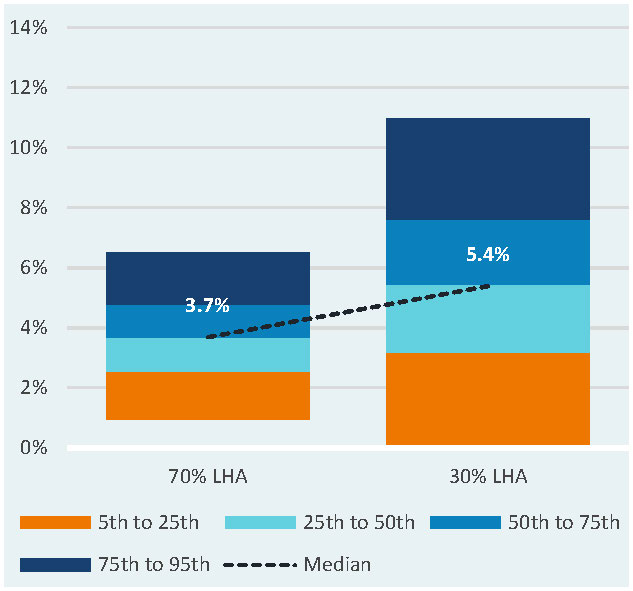
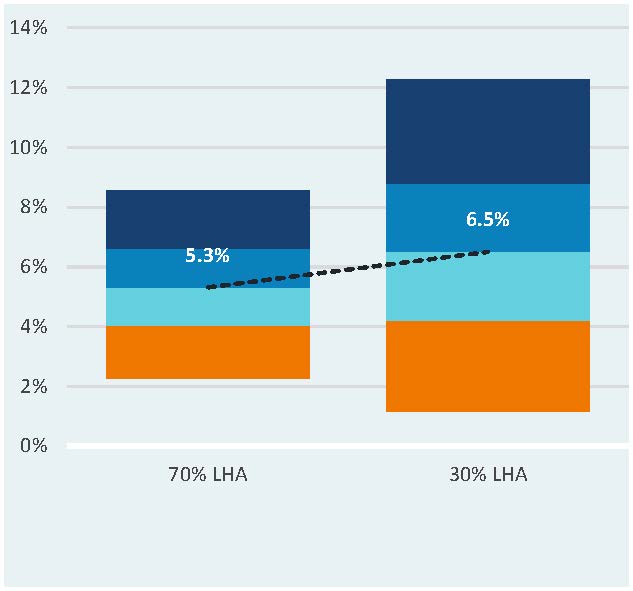
A result of the recent material increases to interest rates is a lower opportunity cost of de-risking through an LDI program. Exhibit 3 compares the 2022 and 2023 Verus’ return expectations of a 30% liability hedging and 70% liability hedging portfolio. In 2022, the de-risked allocation resulted in a 170 bps reduction in expected return, from 5.4% to 3.7%. In 2023, the same shift reduces the plan’s expected return by only 120 bps8. The 70% liability hedging portfolio achieves nearly the same expected return in 2023 as the 30% liability hedging portfolio in 2022.
Exhibit 3. 2022 vs. 2023 Verus 10-year expected portfolio performance
2022 Capital market assumptions
2023 Capital market assumptions
Source: Verus, for illustrative purposes only. The liability hedging portfolio is modeled with core plus fixed income. The return-seeking-portfolio is modeled assuming a typical corporate asset allocation mix of 41% domestic equity, 27% international equity, 7% private equity, 11% private credit, and 14% core real estate.
Other changes in the external environment that may impact plan sponsor attitudes towards LDI include:
- Rising interest rates and relatively strong risk asset performance have improved funding levels for many plan sponsors. As mentioned previously, the benefits of de-risking tend to increase as funding levels improve.
- The asymmetric risk/reward tradeoffs imposed by PBGC variable rate premiums continue to increase due to regulatory changes. In 2013, 0.9% of the unfunded amount was subject to variable rate premiums. Today that percentage has increased more than fivefold to 5.2%.
- Required funding regulations allow ERISA plan sponsors to use a 25-year average of interest rates in setting interest rate assumptions. When interest rates are low relative to that 25-year average, this regulation artificially reduces the actuarial liability that is used to determine funding amounts, which, in turn, reduces required contributions (relative to if they were determined on a market basis). As market interest rates have risen, this interest rate subsidy has worn away, increasing the risk of expedited and increased contribution requirements. De-risking strategies can help mitigate this risk.
Establishing a framework for evaluating de-risking decisions
In this section we will offer plan sponsors a total cost framework for determining the viability of de-risking, given their unique circumstances. First, we will demonstrate a methodology for quantifying the value of LDI. Next, we will discuss the added value of a de-risking glidepath. Finally, we will touch on the value of a risk transfer approach.
Value of LDI strategies
When plan sponsors approach full funding, the benefits of risk-taking decrease for two potential reasons: PBGC premiums (if funded status deteriorates) and taxes (if the plan becomes more than fully funded). These incentivize plan sponsors to de-risk as they approach full funding, all else equal.
We can estimate the total cost to achieve full funding by adding the total cash contributed during the next 10 years to any remaining deficit at the end of the 10 years (which would need to be paid for by the sponsor). The lowest total cost is ideal, of course. An important aspect of the calculation is that the plan sponsor typically does not get to keep funds if they become more than fully funded (due to taxes on surplus assets)9.
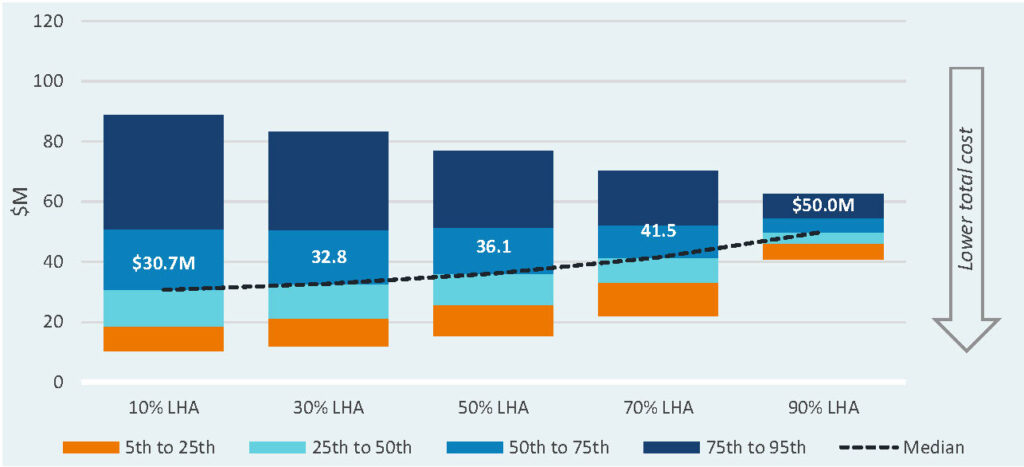
Exhibit 4 displays the range of total cost outcomes for five different portfolios that increase LDI allocations from left to right. The plan sponsor begins the forecast with an 80% funded ratio, and we assume that surplus in excess of 100% funding cannot be recouped by the sponsor (as mentioned, this excess funding is lost to taxation).
When a plan sponsor adopts LDI, typically they trade higher costs for an improved risk profile. But notice that as a sponsor initially adopts a small allocation to liability hedging assets, they may reduce risks without materially increasing cost. As allocations continue to increase, the tradeoff for reduced risk is incrementally greater expected cost. For example, a shift from a 10% to 30% liability hedging allocation results in only a $1.9 million increase to expected costs, whereas the shift from a 70% to 90% liability hedging allocation results in an $8.5 million increase to expected costs. A plan sponsor can use this framework, combined with an understanding of their risk tolerances, to choose a “sweet spot” (the right balance between risks and total costs).
Exhibit 4. Total cost to plan sponsors based on 80% starting funded ratio
Added value of a glidepath
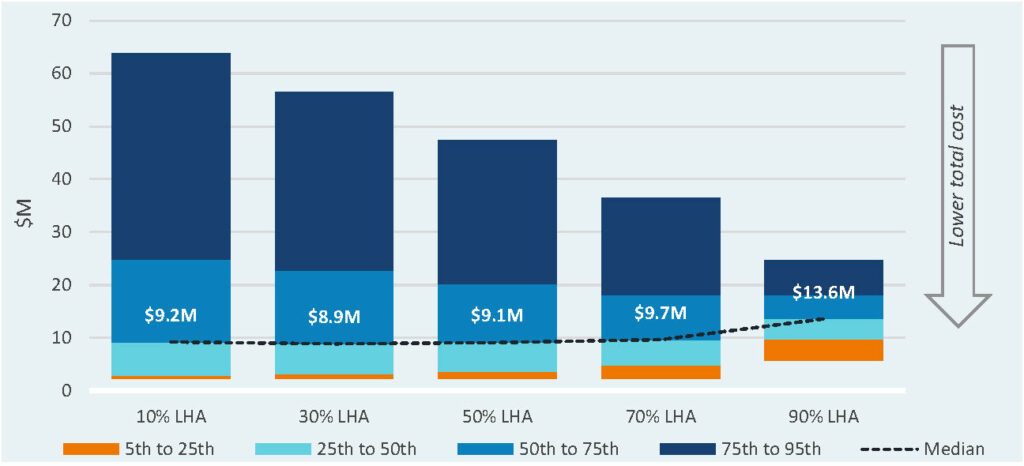
As mentioned, the value of de-risking increases as full funding is approached. This is illustrated in Exhibit 5, where we again show the range of total cost outcomes but increase the starting funded ratio to 95% (in the previous example, the starting funded ratio was 80%). As the funded ratio improves, the portfolios with higher allocations to LDI look more attractive. Now, the initial movement from a 10% to 50% liability hedging portfolio creates true “win-win” opportunities by decreasing expected cost while also taking risk off the table (a rare proposition!). Furthermore, we see that the adoption of a 90% liability-hedging portfolio comes with lessened opportunity cost when starting from a 95% funded ratio (a $3.9 million expected increase instead of $8.5 million).
Exhibit 5. Total cost to plan sponsor based on 95% starting funded ratio
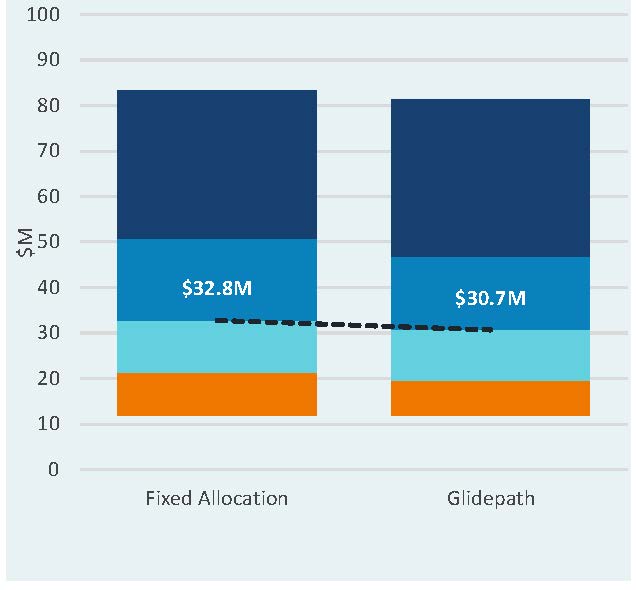
Glidepaths take advantage of this property to improve financial outcomes. A glidepath is an investment strategy where allocations shift from return-seeking to liability-hedging asset classes on a predetermined basis as the plan’s funding levels improve10. In Exhibit 6, the financial outcomes of a fixed 30% liability hedging allocation and glidepath are compared over a 10-year period (this chart shows the expected outcome at the end of the 10 years). The glidepath in this scenario also starts at a 30% liability hedging and increases at funded ratios of 85%, 90%, 95%, 97.5% until reaching a 100% liability hedging allocation at 100% funding levels11.
Exhibit 6. Fixed allocation vs. glidepath – 80% starting funded ratio
Funded ratio after 10 years
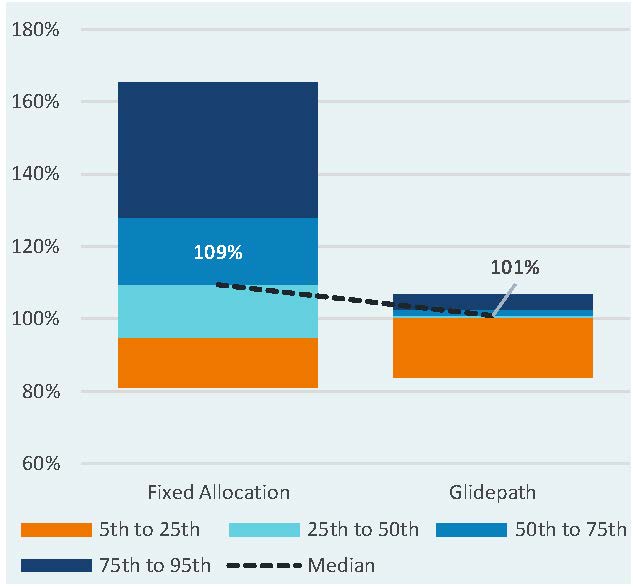
Total cost to plan sponsor
Source: Verus, for illustrative purposes only. The liability hedging portfolio is modeled with core plus fixed income. The return-seeking-portfolio is modeled assuming a typical corporate asset allocation mix of 41% domestic equity, 27% international equity, 7% private equity, 11% private credit, and 14% core real estate.
Adopting a glidepath has the following impacts relative to a fixed allocation:
- The potential for higher liability allocations reduces the median funded ratio from 109% to 101% and narrows the range of funded ratio outcomes significantly.
- Despite the lowered median funded ratio, the probability of being 100% funded at the end of the 10 years improves from 66% to 77%. By reducing the probability of being underfunded, the plan also reduces its expected PBGC costs.
- The plan sponsor captures an expected “win-win” economic opportunity by adopting a glidepath. The expected cost is reduced from $32.8 million to $30.7 million while also reducing the cost in adverse economic scenarios.
Risk transfers as an additional de-risking tool
Plan sponsors de-risk through risk transfer when they offload (sell) certain future obligations to another entity. Common forms of risk transfer include annuity purchases and offering lump sum payments to participants. In an annuity purchase, insurance carriers agree to make future benefit payments to certain participants. In exchange, the plan sponsor pays a premium up front to the insurance carrier. When paying lump sums, plan sponsors pass risk on to participants by paying out a lump sum today in lieu of providing benefits to them in the future.
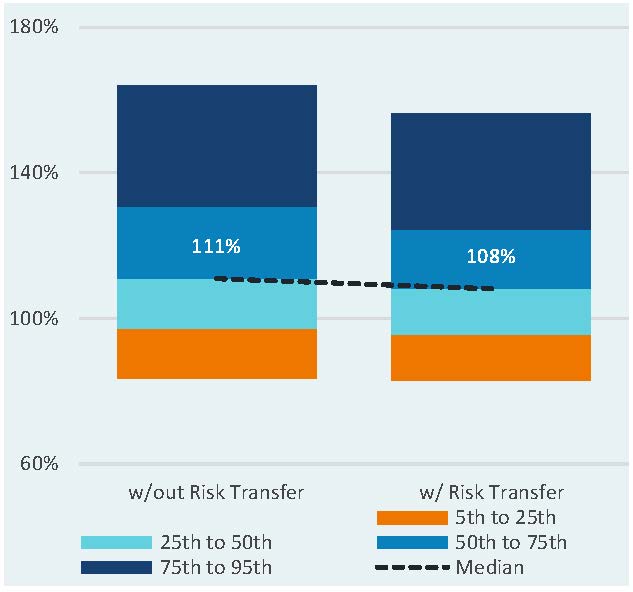
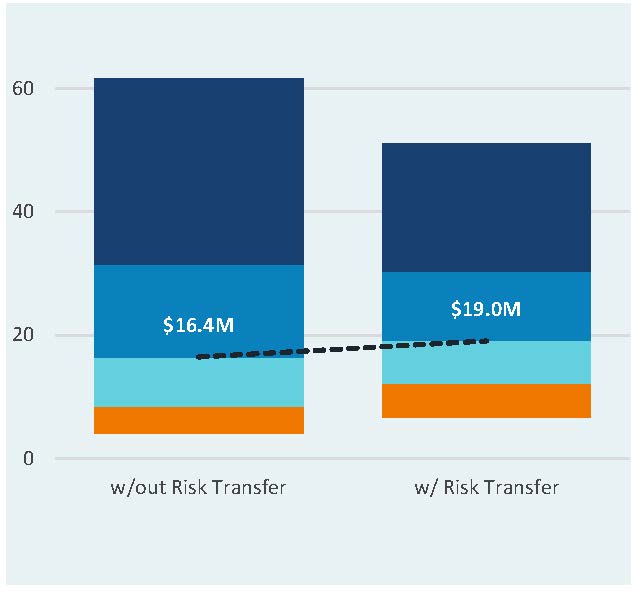
In Exhibit 7, we illustrate the impact of adopting a risk transfer strategy to settle 30% of the plan’s obligations up front12. The cost of this settlement is assumed to be 105% of the value of the underlying liability that is offloaded.
Exhibit 7. Impacts of risk transfer – 90% starting funded ratio
Funded ratio after 10 years
Total cost to plan sponsor
Source: Verus, for illustrative purposes only. The liability hedging portfolio is modeled with core plus fixed income. The return-seeking-portfolio is modeled assuming a typical corporate asset allocation mix of 41% domestic equity, 27% international equity, 7% private equity, 11% private credit, and 14% core real estate.
Settling 30% of the plan immediately through risk transfer has the following impacts:
- Cost: Forecasted funded ratio outcomes worsen at every percentile because the up-front risk transfer reduces the starting funded ratio13. The expected total cost increases, primarily because of the 5% premium on the transaction.
- Benefit: The benefit of risk transfer can be seen by analyzing the total cost. By fully locking in the economic cost of providing benefits for certain participants up-front, the plan sponsor shrinks the size of the plan and tightens the range of economic outcomes.
Similar to LDI, risk transfer activity generally increases expected costs while reducing the possibility of adverse outcomes for the plan. As shown above, a unique drawback of risk transfer is that it generally reduces the starting funded status, putting more pressure on the investment portfolio to achieve full funding. This is a drawback that plan sponsors can avoid with an LDI approach14.
Conclusion
Recent improvements in funded status and the opportunity to adopt LDI at a lower opportunity cost both increase the potential for “win-win” economic opportunities that can be achieved through de-risking. It may, therefore, be prudent to re-visit asset allocation decisions to consider de-risking strategies.
The ideal asset allocation is ultimately a function of an organization’s own risk tolerance and circumstances. All else equal, plan sponsors will likely find de-risking more attractive if:
- The sponsor is willing to trade stability for higher expected cost outcomes.
- Surplus assets become harder to revert back to the sponsor.
- Funding levels improve.
- Benefits are frozen.
- Time horizon for termination shrinks.
- The plan is subject to PBGC premiums and PBGC premiums continue to increase.
- The sponsor is subject to mark-to-market financial reporting requirements.
- The sponsor holds greater allocations to illiquid asset classes.
For more information regarding these approaches or our views on the environment, please reach out to your Verus consultant.
Notes & Disclosures
- The hedge ratio is the duration of the asset portfolio divided by the duration of the liability multiplied by the funded ratio of the plan. Duration is a measure of interest rate sensitivity.
- Theoretically the funded status impact would be zero, although duration estimates are often approximations of interest rate sensitivity.
- Heat map reflects hedge ratios of 27% and 63% for the 30% and 70% liability hedging portfolio, respectively. Return-seeking assets are non-liability hedging assets.
- This is a “stochastic” analysis which involves the use of hundreds or thousands (or more) randomized trial runs, assuming a given distribution, to gain an idea of what the future might look like. Monte Carlo analysis is a type of stochastic analysis.
- The Pension Benefit Guaranty Corporation (PBGC) is a U.S. Federal agency that provides insurance for private sector defined benefit plans in the event of insolvency. A component of the annual premiums that are paid to the PBGC is the “variable rate premium (VRP),” which is directly tied to funding and eliminated when fully funded on a PBGC basis. In 2023, 5.2% of a plan’s deficit is paid as a VRP premium, subject to a cap of $652/participant.
- Form 5500s, which are filed with the Department of Labor, report information related to employee benefit plans and are publicly available. Annual funding notices are provided to all participants annually to provide information regarding the financial health of the plan. PBGC 4010 filings are filed only when funding levels fall below a certain threshold and is used by the PBGC to identify plan sponsors who pose a risk of insolvency.
- Depending on the sponsor’s tax status, surplus assets may be subject to a 50% excise tax in addition to income taxes.
- Expected returns of liability hedging asset classes were the most impacted by rising interest rates.
- The economic benefit available to plan sponsors from surplus assets can vary significantly based on a sponsor’s tax status, whether the plan is frozen, the sponsor’s other employee benefit plans, and cost of plan termination.
- In a one-way glidepath, plan sponsors do not re-risk allocations when funding levels fall. In a two-way glidepath, a worsened funding position allows for re-risking.
- Glidepath reflects 30% LHA at 0% funding, 40% LHA at 85% funding, 50% LHA at 90% funding, 70% LHA at 95% funding, 85% LHA at 97.5% funding, and 100% LHA at 100% funding.
- Results reflect 30% liability hedging allocation.
- This results from the 5% premium paid which increases the funding deficit on a dollar basis. It also results from a dilution effect (e.g., if there was no premium, taking an equal amount of assets and liabilities from an underfunded plan will still reduce the funded ratio).
- A benefit of risk transfer that does not exist under LDI is the potential for economic value creation resulting from the fact that PBGC premiums are largely tied to participant headcounts. By settling the participants with the lowest benefits first, plan sponsors can achieve relatively high levels of expense reduction compared to the premium cost.
Past performance is no guarantee of future results. This report or presentation is provided for informational purposes only and is directed to institutional clients and eligible institutional counterparties only and should not be relied upon by retail investors. Nothing herein constitutes investment, legal, accounting or tax advice, or a recommendation to buy, sell or hold a security or pursue a particular investment vehicle or any trading strategy. The opinions and information expressed are current as of the date provided or cited only and are subject to change without notice. This information is obtained from sources deemed reliable, but there is no representation or warranty as to its accuracy, completeness or reliability. This report or presentation cannot be used by the recipient for advertising or sales promotion purposes.
The material may include estimates, outlooks, projections and other “forward-looking statements.” Such statements can be identified by the use of terminology such as “believes,” “expects,” “may,” “will,” “should,” “anticipates,” or the negative of any of the foregoing or comparable terminology, or by discussion of strategy, or assumptions such as economic conditions underlying other statements. No assurance can be given that future results described or implied by any forward looking information will be achieved. Actual events may differ significantly from those presented. Investing entails risks, including possible loss of principal. Risk controls and models do not promise any level of performance or guarantee against loss of principal.