
Download the Topic of Interest (PDF)
An evolving market environment has arguably diminished the role of traditional fixed income as a diversifier in portfolios, and led to a higher opportunity cost of holding bonds due to lower yields. This may suggest improved relative attractiveness of other equity risk mitigation approaches. In this research piece we discuss other approaches to risk mitigation and outline their merits, while tying these ideas to the Functionally-Focused Portfolios (FFP) approach to portfolio construction.
Introduction
Our views around a proper risk mitigation approach are three-pronged: First, tail risk hedging with derivatives tends to be impractical due to the high costs (drag) of this approach, as buyers of derivative contracts tend to pay a premium and sellers of these contracts receive a premium. Second, the efficacy of traditional fixed income as a primary means of risk mitigation has been brought into question due to ultra-low interest rates and weakened diversification benefits (upside potential) during future market selloffs. Third, we believe other asset classes and strategies may fulfill or partially fulfill the role of fixed income in the current environment. In this Topic of Interest white paper we lay out our work supporting the three claims above, and outline specific risk mitigation solutions that we believe may appropriately serve investors in the current market landscape.
Why does traditional tail risk hedging tend to be impractical?
The search for alternative ways to mitigate equity risk often begins with the obvious question: why not buy derivatives contracts that pay off when equities fall? For example, it is possible for an investor to effectively lock-in the gains of a U.S. stock portfolio by purchasing enough at-the-money put options on the S&P 500 to offset potential future losses. These options contracts gain in value if the index falls below its current level, effectively counteracting market losses. However, the long-term cost of maintaining such an aggressive “protective put” position will consume much of the portfolio’s future long-term return. If it were not so, virtually all investors would be incentivized to engage in this practice.
For every “hedger” there is a “speculator”, i.e., someone on the other side of the derivative contract. This speculator requires adequate compensation for bearing the risk that the hedger is avoiding. In this case, that compensation takes the form of options premiums, which are paid by the option buyer and received by the option seller. Because of the methodology used for pricing options (i.e., Black-Scholes model), during times of increased market volatility or stress, those premiums can grow to be substantial.
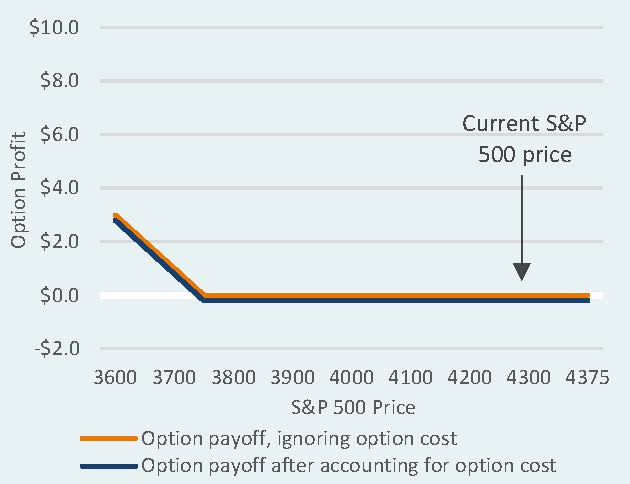
A hedger can lower the cost of protection by accepting a lesser form of protection. For example, a protective put position can consist of far out-of-the-money contracts, which have zero payoff at maturity if the stock market does not suffer a serious decline. This practice is called “tail risk hedging”, which refers to the left tail of the stock market probability curve, where all the worst outcomes reside (see illustration below). The cost of this hedging approach is lower due to a lower probability that the option will provide a positive payoff (i.e. lower probability that the option will become in-the-money).
Put option payoff curve
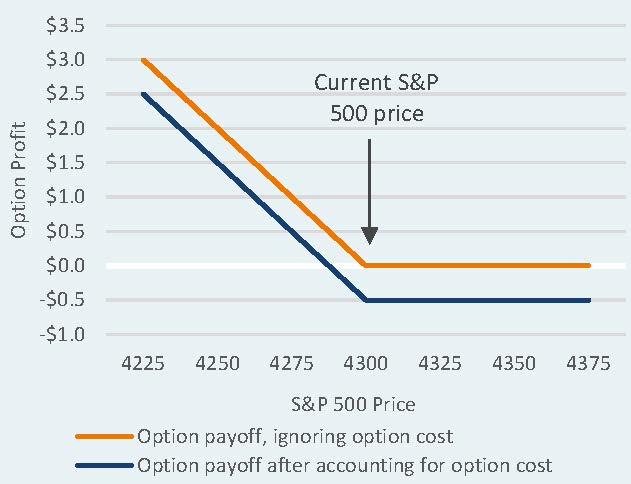
Out-of-the-money put option payoff curve
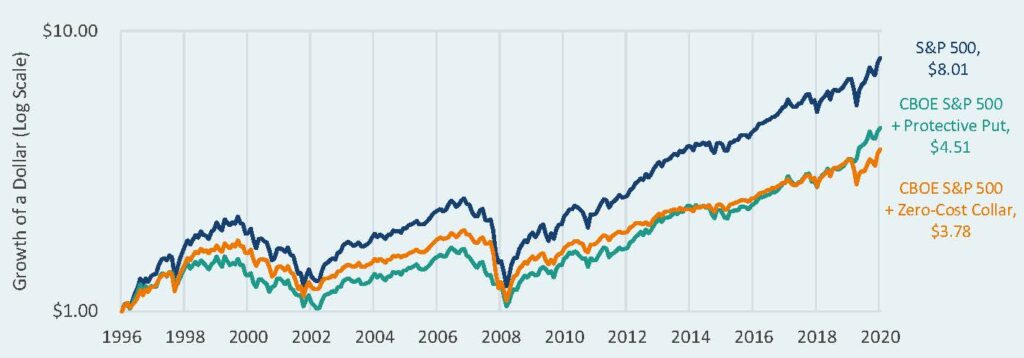
Additional tail risk strategies include “put spreads”, “zero-cost collars”, and “zero-cost put spread collars”—all designed to reduce the net cost of maintaining the derivatives position by accepting various tradeoffs. The options exchange, Cboe, maintains indices based on naïve monthly-rebalanced implementations of these strategies. In a previous Topic of Interest we examined the long-term history of these indices and found that not only did they exhibit an unacceptably high drag on long term return, but they were also often surprisingly ineffective. We could easily dedicate an entire paper to explaining why, but a primary reason is that an options hedge must be constantly adjusted to be effective—once per month is not enough.
Tail hedging indices
There are investment firms that have shown some ability to effectively implement tail risk hedging by using more sophisticated methods, and their outsized positive returns were in the headlines in 2008, as well as last year when the pandemic initially struck. However, there were also stories of pension plans that had terminated tail risk hedging accounts just prior to the crisis thereby suffering both the negative costs of maintaining the hedge during non-crisis periods and the full impact of the crisis post-tail risk strategy unwind. This illustrates the potential significant headline risk associated with tail risk hedging implementation and why tail risk hedging is arguably not an attractive proposition for most institutional investors, especially those sensitive to headline risk. At its best, tail risk hedging is essentially an insurance policy with years of premium payments that take the form of a near-constant drag on total fund performance in the range of approximately 50 to 80 basis points. This creates the risk that a “regime change” among staff or fiduciaries could result in the decision to cancel the insurance policy just before it potentially pays out.
The diminished role of fixed income as a diversifier
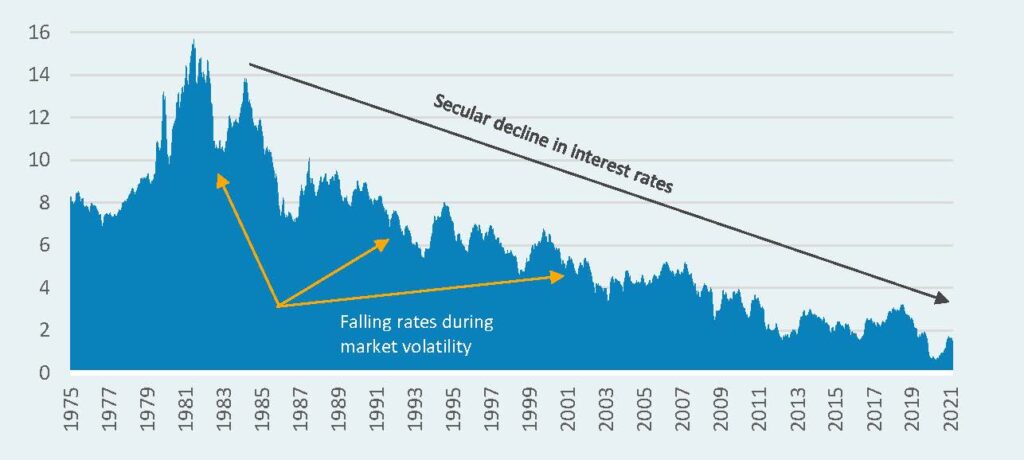
For the past forty years fixed income has provided fantastic diversification benefits while also delivering generally strong returns due principally to the fact that interest rates have seen a secular decline. In more recent years, market tumult has tended to push bond yields lower (and pushed prices higher), meaning fixed income investors experience positive performance during risk asset selloffs. This long-term trend of falling interest rates has acted as a windfall for fixed income investors as bond prices move higher and higher.
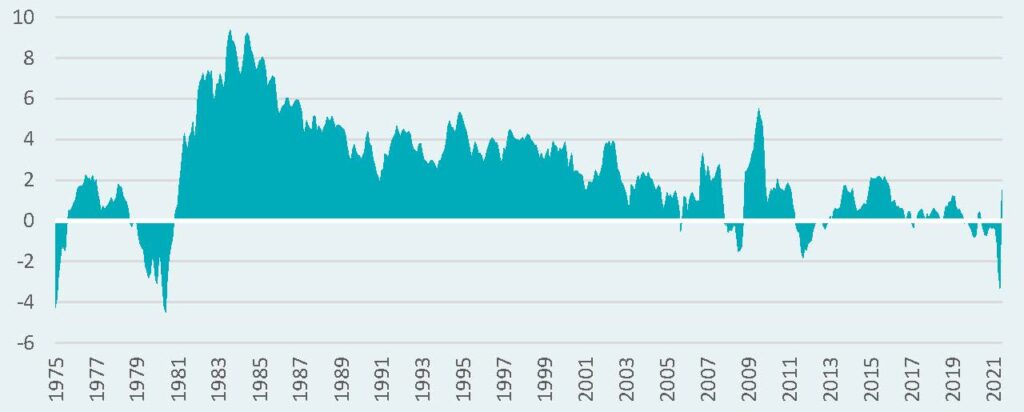
10-Year U.S. Treasury Yield
Now, in the current environment, the punchbowl may be running dry. Most investors would likely agree that interest rates cannot move much lower than 0%. This creates two major issues for the role of fixed income as a diversifier:
- First, during the next market selloff, the positive performance that investors might expect from their fixed income portfolio is inherently dampened. When in past market selloffs interest rates might fall by 2% or more, generating decent positive performance from fixed income, the upside from bonds is now lessened because interest rates are already close to 0% (i.e. close to their expected “floor”).
- Second, the long-term secular decline in interest rates is arguably finished now that the Fed has effectively taken the reins on managing inflation within a narrow range. This means that fixed income performance will likely no longer benefit from the ongoing tailwind of lower and lower interest rates (i.e., higher and higher prices).
It is worth noting that the two unattractive realities of fixed income stated above, which imply the diversification benefits of fixed income have been diminished, coincide with a general consensus that future fixed income returns will be very low for the long-term, relative to history. As we see below, the “cost” of holding fixed income is now higher with yields not even fully compensating investors for the rate of inflation. It is reasonable to ask whether other risk diversifying assets and strategies might offer a more attractive cost/benefit tradeoff to supplement, or even replace, traditional fixed income.
Real (after inflation) 10-Year U.S. Treasury Yield
Fixed income replacement: other asset classes & strategies
Over the past few years, plan sponsors have been wrestling with the issue of how to address the future potential return drag of traditional fixed income on their portfolios. Consultants and asset managers have developed portfolio solutions tailored to assist these plan sponsors in addressing this issue. We believe the resulting solutions can be parsed into three broad categories: (i) private debt; (ii) low volatility hedge funds/absolute return strategies; and (iii) levered bonds.
i. Private debt
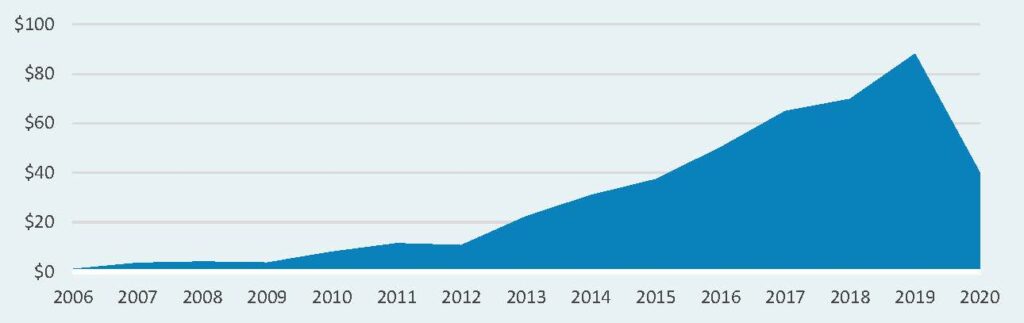
Over the past decade, shorter maturity private debt, such as direct lending in the middle and lower markets, has become a meaningful part of many large institutional portfolios. Direct lending strategies proliferated in the post-Global Financial Crisis era as banks were pushed to exit the middle and lower markets due to increased regulatory capital requirements and other regulatory hurdles. Non-bank financial intermediaries quickly filled the space by reaching out to institutional investors for capital to directly lend to companies in this market segment, most of which are privately owned. The following exhibit shows the growth of this market segment (which also includes venture debt) over this period2.
Annual Global Direct Lending Capital Raised ($Billion)
Historically, private equity managers provided access to the private debt markets through mezzanine and distressed lending, but did not participate in the middle and lower middle market segments because the average EBITDA’s of these firms were below their thresholds for company investments. Additionally, direct lending in the form of senior and subordinated loans over shorter time horizons (typically 3 to 5 years) tends to yield IRR’s in the high single/low double-digit range, which is also below the range targeted by private equity investors. Lastly, fees and carry are lower, which further reduces the appeal to private equity investors.
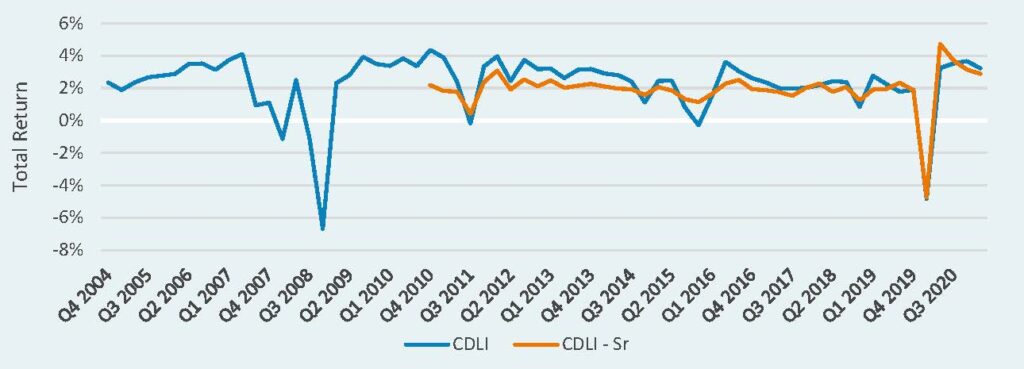
However, high single digit returns for relatively high-quality direct loans that are illiquid over a 5 year or less time horizon may be a very attractive option for institutional investors, even for those plans that are cash flow negative. The following exhibit shows returns for the Cliffwater Direct Lending Index (“CDLI”) and senior loan version of the index since their respective inceptions.
Direct Lending & Senior Loan Performance
ii. Absolute return strategies/diversifying hedge funds
Verus has long maintained that hedge funds are not an asset class. We believe that in most cases, typical hedge funds belong within broader asset classes where the volatility, correlations, and returns are reflective of common risk drivers. For example, we believe long/short equity or activist hedge funds can play a role within the public equities asset class “bucket””, distressed debt hedge funds fit nicely within credit portfolios, and so forth. However, there are hedge funds styles that tend to be more absolute return in nature: they exhibit low correlations and betas with equities and can serve as fixed income substitutes despite having little or even no persistent exposure to interest rate risks (i.e. duration). Examples of these strategies include CTAs/Systematic Macro, Discretionary Macro, Structured Credit, Fixed Income Arbitrage, Insurance-Linked Securities, or Equity Market Neutral. The commonality tends to be a low beta and correlation to equities (0.3 or less), low absolute volatility (4-8% is common) and often a low correlation to public fixed income (0.5 or less). Thus, these are truly diversifying strategies that could warrant their own separate role within an institutional portfolio.
iii. Levered bonds
In response to the 2008-2009 Global Financial Crisis, a handful of public funds deviated from their peers and resolved to reduce the equity contribution to risk in their portfolios by implementing total fund leverage. This leverage was used to amplify exposure to high quality investment grade bond and TIPS allocations to varying degrees. This seemed to rhyme with the approach employed by many risk parity managers, whereby Commodities and TIPS play a greater role in portfolios through leverage. The intended effect was to maintain high growth, but at a lower overall level of risk. Unfortunately, some public funds that pursued these strategies (as well as many risk parity managers) have somewhat lagged their unlevered peers throughout the relentless equity bull market subsequent to the GFC period. While modest total fund leverage (i.e., 10% or less) would likely not have meaningfully truncated total fund returns, much larger levels (i.e., > 20%) would have done so. Highly levered bonds, TIPS, etc. will act like portfolio insurance or tail risk hedging strategies during periods of strong equity performance. Thus, the negative aspect of this approach is that, similar to tail risk hedges, the benefits are episodic and can be a meaningful detractor if implemented on a large scale. However, unlike tail risk hedges, there is no explicit annual “cost” of implementation. This is because levered bonds should likely be additive to portfolio performance in most market environments, rather than creating the consistent drag that is required of traditional tail risk hedging strategies. Thus, modest total fund leverage (i.e., 20% or less), is a reasonable approach for some institutional investors that have the ability to establish lines of credit and/or borrow in the Repo markets to effect this strategy.
Another way to implement levered assets is simply at the asset class level for low returning assets, such as bonds currently. Treasury futures, CDX derivatives and mortgage repos facilitate levering bond portfolios. To determine the appropriate leverage level, plan sponsors target the volatility level and take into account current cash yields as the cost of financing to arrive at the commensurate expected return. Larger levels of leverage can be assumed at the asset class level as the maximum drawdown is less, given that a smaller asset base is being levered than at the total fund level. Commodities or other non-fixed income assets would not be a subset of the leveraged assets in this scenario.
Risks to be considered for alternative fixed income strategies
The two main fixed income risks are interest rates and credit spreads, followed by convexity, which is a risk especially notable in many asset-backed securities. When considering fixed income alternatives to diversifying equity risk, there are other risks which need to be considered. We list these additional risks below.
- Illiquidity: Direct lending, CLO and insurance linked securities (“ILS”) are generally illiquid, although there are publicly traded ILS. The period from when capital is invested and returned can range but is generally between 18 months and up to seven years, although the more typical range is between one and three years for direct lending and between 6 months to four years for ILS. Absolute return strategies have liquidity quarterly, but some strategies can be locked up for three years. Liquidity risk can be mitigated by focusing on higher quality loans and diversifying across strategies. Many direct lending strategies do provide income quarterly.
- Counterparty: This risk occurs when a party to a transaction defaults on its contractual obligation to deliver promised cash flows and is akin to default risk. The higher the counterparty risk (generally as a result of perceived default or credit risk), the higher the premium compensation demanded by the plan sponsor. Counterparty risk is present for derivative-based and absolute return strategies as prime brokers are generally a counterparty. It is also a risk for levered strategies. Counterparty risk can be mitigated by utilizing multiple counterparties and/or highly rated counterparties as well as well-structured ISDA’s.
- Leverage: This risk is driven by the use of borrowed capital (i.e., debt) to increase (“amplify”) returns. The risk of leverage comes from the amplification effect as negative returns will be amplified, as will positive returns. Leverage risk may result in a need to deploy additional capital to support the leverage strategy at an inopportune time. In addition to an explicit leverage implementation, such as with levered bonds, there can be implicit leverage in direct lending strategies. This is the case when a manager employs leverage at the fund level. Absolute return strategies can also involve leverage. It is important for investors to understand the levels of leverage in these strategies, as well as the context in which leverage is used, since leverage is often used to reduce overall strategy risk.
- Hidden equity factor: The higher risk nature of certain fixed income alternatives should be noted. If these alternatives are intended to diversify portfolio equity risk, alternatives with higher equity ‘beta’ or higher correlation to risk assets more generally should be approached more cautiously. These characteristics can become evident during times of equity market stress, such as was observed throughout the 2007 Subprime Crisis and subsequent 2008 Global Financial Crisis. Credit-oriented strategies will generally have a higher correlation with equities. A way to mitigate this risk is to understand the underlying portfolio construction philosophy and process for absolute return strategies and to focus on higher quality, shorter duration loans for direct lending strategies. Utilizing ILS and other idiosyncratic strategies such as real estate debt and structured credit backed by assets might help reduce this risk exposure.
- Credit/default: This risk can be mitigated through utilizing strategies focused on higher quality debt, overcollateralization and shorter investment horizons.
There may be other risks such as currency risk and interest rate risk which should be recognized and evaluated for their contribution to overall strategy risk; however, those risks highlighted above will be the main risks to manage in the utilization of strategies as fixed income alternatives.
Implementation fees and costs
Fees and costs are a key variable in any investment decision. Public markets fixed income strategies average around 25 basis points for a commingled fund and between 5 and 20 basis points for a separate account. Alternative fixed income strategies cost quite a bit more. Direct lending and other debt-oriented strategies range between 0.5% and 1.5% for management fees and usually have an incentive fee component between 10% to 15%. The fees for low volatility hedge funds can be lower than the standard ‘2 and 20’, but for fund solutions, that may not be the case. Managers claim expected returns on direct lending, ILS, CLO and other alternative fixed income strategies range between 8% and 12%. Plan sponsors should expect net of fee and cost returns to range in the 5% to 8% range. Verus’ current 10-year expected return for Private Credit strategies is 4.6%. This represents a ‘beta’ return and does not reflect an assumption for manager value-added. Low volatility hedge fund strategies, net of fees, can be expected to earn a lower range of returns, 2% to 4%, given the ‘2 and 20’ fee structure. However, even those lower net of fee expected returns are higher than Verus’ current 10-year expected return for global aggregate bonds, which is 1.1%.
Functionally focused portfolios (FFP)
The topics covered in this white paper tie closely with an approach to portfolio construction that we refer to as “Functionally Focused Portfolios” or “FFP”. We believe FFP is worth mentioning here, as diminishing diversification benefits of traditional fixed income may lead some investors to pursue risk mitigation in a more targeted way.
FFP involves a different fundamental approach to portfolio construction. Instead of classifying portfolio exposures based on asset class or risk labels, exposures are grouped by the role that they play in the portfolio:
- Liquidity provision & short-term spending needs: This category include assets which are depended on to meet monthly net outflows from the portfolio and also provide a liquidity cushion.
- Long-term growth assets: This category includes assets that should provide sufficient growth to sustain the portfolio value in perpetuity.
- Portfolio diversification strategies: This category contains exposures intended to reduce the volatility of the growth portfolio and provide liquidity to take advantage of market opportunities.
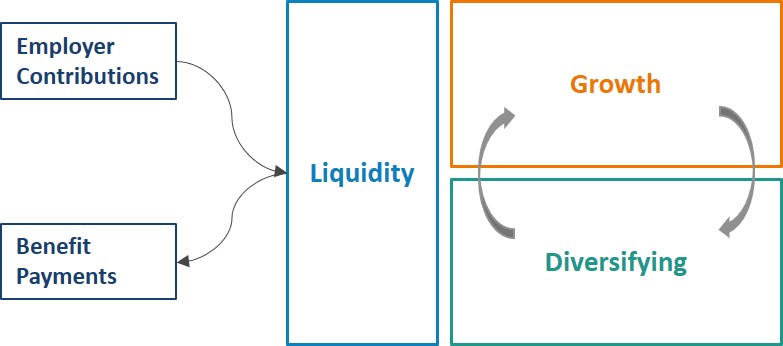
Relative to traditional approaches to asset allocation, FFP places liquidity at the center of the process and builds in growth and diversification once that core liquidity function has been satisfied. The core liquidity pool is continuously replenished from contributions and investment income. The growth and diversifying portfolios are periodically rebalanced, based on market movements.
FFP: Dynamic Rebalancing Process
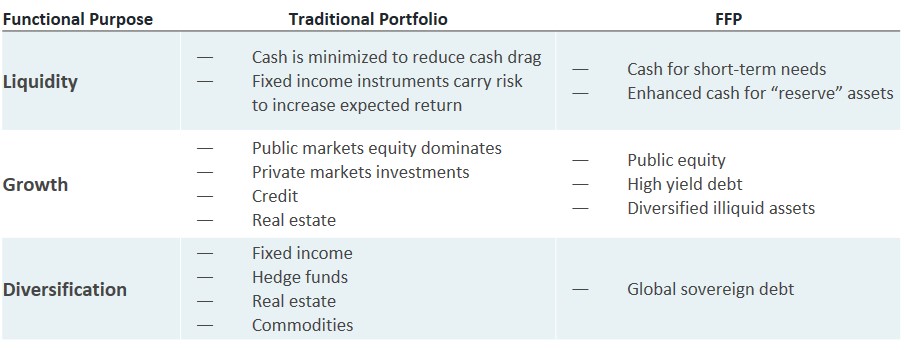
In terms of implementation, FFP generally calls for a barbell approach with much higher cash and equivalents, much more illiquidity, and highly liquid, low correlation assets in between. These structural differences often provide the benefits of: (1) a more diversified risk factor set, (2) greater portfolio efficiency, (3) more mild drawdowns, and (4) greater overall portfolio simplicity. Although, investors should also consider that FFP may reduce upside potential during strong market environments, and greater peer risk.
Structural Differences Between Traditional Allocation & FFP
As discussed in a recent Verus Topic of Interest paper, titled Is Painless Diversification Dead?, we wrote that diversification has different definitions. One definition is the preservation of capital during market selloffs. The other definition is asset performance that is inverse to risk asset performance (assets which tend to appreciate in value during market selloffs). These definitions of diversification correspond to FFP ideas #1 and #3 listed above. Traditional fixed income has historically fulfilled both of these roles fairly well, but may not fulfill both in the future, due to the reasons we outlined above. As many investors are forced to decide which definition of diversification is most needed in their specific portfolio, they may find the FFP framework to be useful in these portfolio construction discussions.
Asset allocation and alternative fixed income strategies
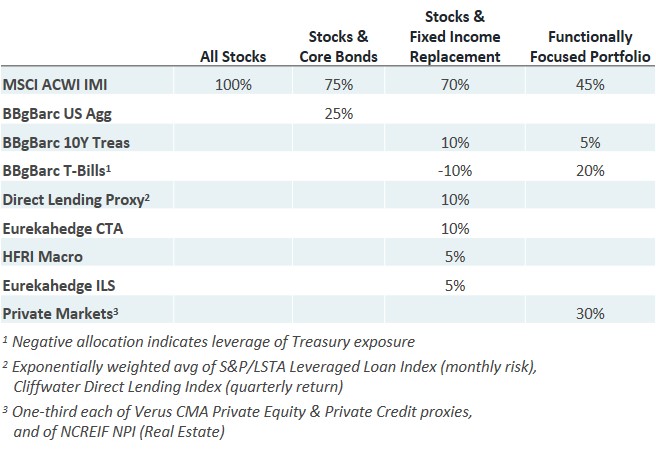
Verus believes some combination of the alternative fixed income strategies discussed above may fulfill, or partially fulfill, the role of fixed income in the current environment. The key question is how cost-effective are they at equity risk mitigation compared to pure fixed income? To better understand their efficacy as fixed income alternatives, Verus conducted both historical and factor-based analyses of both a hypothetical fixed income replacement strategy and a functionally focused portfolio. As a basis of comparison, we also evaluated a pure global stock portfolio and a 75/25 mix of global stocks and core bonds. The 75/25 mix appropriately represents the risk profile of today’s institutional plan sponsors (as opposed to the popularly referenced 60/40 policy mix) given the drive to maximize return growth in the face of lower expected returns for equities and other asset classes.
Hypothetical asset mixes
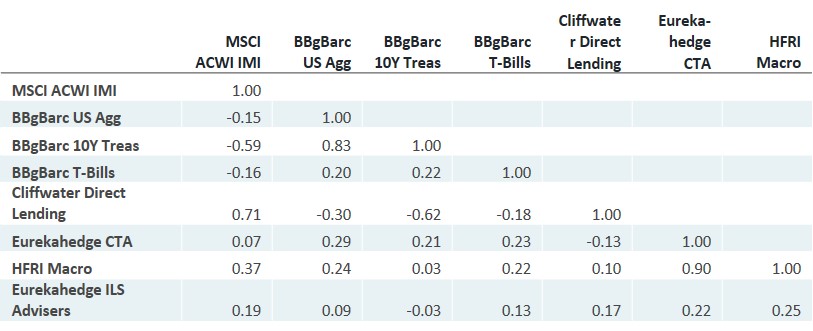
Performance of all the hypothetical portfolios is summarized in the two exhibits below. The following exhibit presents the historical equity correlations for the alternative fixed income strategy types referenced in the prior sections. We see that for the most part, the correlations to equities and fixed income have been very low for these alternative fixed income strategies. The exception is the direct lending to equity correlation of 0.7.
Index correlations (2006 Q2 to 2020 Q4)
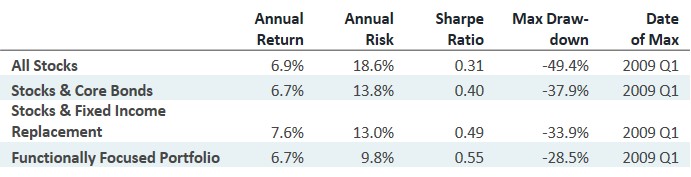
The following exhibit provides the results of Verus’ asset allocation analysis which compares the historical performance results of the 75/25 equity/fixed income policy mix to the historical performance results of a policy mix which includes the three main types of fixed income alternatives instead of fixed income. What we see is that for the return to risk profile of the 75/25 equities/ fixed income policy mix, a 70/30 equities/fixed income alternatives policy mix achieves a similar return to risk profile over the 14-year period examined. Interestingly, the maximum drawdown of that mix is improved relative to the 75/25 policy mix. As this period includes the Subprime and Global Financial Crises (2007 – 2008), Taper Tantrum (2013) and COVID shock (March 2020) periods, it provides a higher degree of comfort regarding how these alternative fixed income strategies may likely perform in equity and fixed income stress periods.
Hypothetical asset mix performance (2006 Q2 to 2020 Q4)
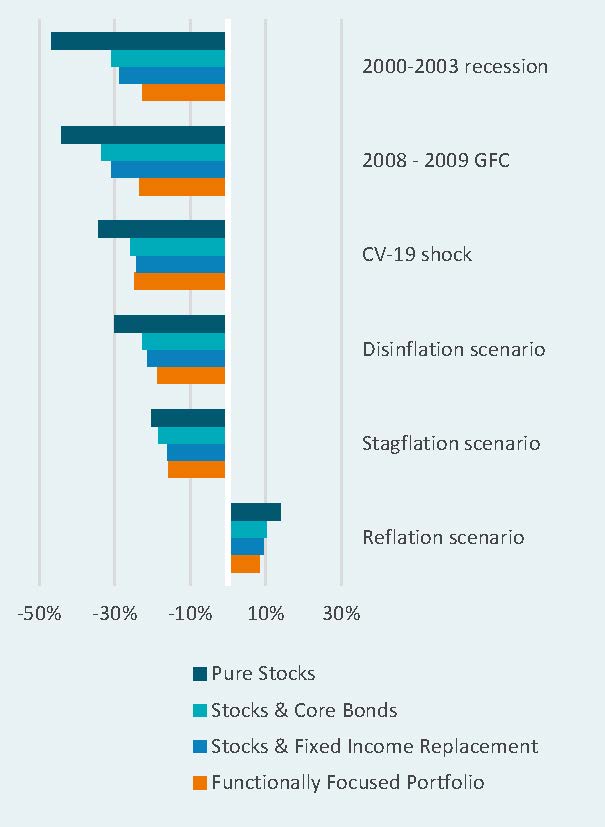
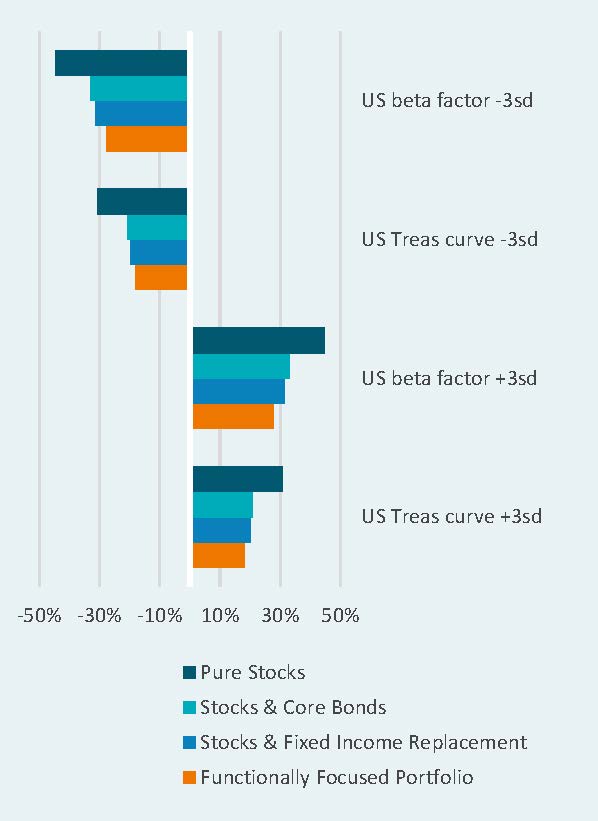
In the factor analysis we examined two different types of scenarios. First, we subjected the portfolios to the same historical market factor shocks that had occurred during some of the worst historical periods, such as the 2008-2009 Global Financial Crisis. Second, we applied market factor scenarios characteristic of past economic regimes like disinflation. In addition, to be as forward-looking as possible, we constructed stress tests that involved three standard deviation shocks to single risk factors, such as U.S. equity beta, with the model providing appropriately correlated shocks to all other risk factors. These were truly generalized stress tests, free of the idiosyncrasies of past historical events.
As seen in the charts below, the portfolio representing a fixed income replacement strategy (medium blue bars) provided at least as much downside protection in the major scenarios as the portfolio with a simple core bond allocation. This was also true in the purely forward-looking stress tests. Due to having the lowest total equity exposure, the portfolio representing a functionally focused approach provided even more downside protection, particularly in the longer crisis scenarios. However, the low equity exposure also caused the FFP portfolio to underperform in the positive shock scenarios and stress tests.
Factor analysis – scenarios
Factor analysis – stress tests
Conclusion
An evolving market environment has arguably diminished the role of traditional fixed income as a diversifier in portfolios and led to a higher opportunity cost of holding bonds due to lower yields. This may suggest improved relative attractiveness of other equity risk mitigation approaches. In this Topic of Interest, we offered three conclusions around risk mitigation approaches. First, tail risk hedging with derivatives tends to be impractical due to the high costs (drag) of this approach, as buyers of derivative contracts tend to pay a premium and sellers of these contracts receive a premium. Second, the efficacy of traditional fixed income as a primary means of risk mitigation has been brought into question due to ultra-low interest rates and questionable diversification benefits (upside potential) during future market selloffs. Third, we believe other asset classes and strategies may fulfill or partially fulfill the role of fixed income in the current environment. We demonstrated that implementation of risk mitigation strategies such as those discussed in this paper can result in a portfolio with similar return/risk profile and potentially lower drawdown impact than portfolios currently reliant on traditional fixed income as the main equity risk mitigation tool. Overall, these topics tie closely with an approach to portfolio construction that we refer to as “Functionally Focused Portfolios” or “FFP”, which involves classifying portfolio exposures based on the role that they play in the portfolio. As investors are increasingly forced to choose the type of diversification that they wish to pursue in portfolios, a FFP framework may add clarity to this decision-making. For more information on these perspectives around portfolio risk mitigation, please reach out to your Verus consultant.
1 Source: Pitchbook