
Executive Summary
Core real estate has faced a series of setbacks over the last several years. From the uncertainty created by the pandemic, the industry moved to a post-COVID euphoria that saw the highest returns in the NFI-ODCE Index history, followed by a sustained drawdown driven by the largest rate hike in the last 40 years. In this Topic of Interest paper, we will address the state of the core real estate fund universe. We will be discussing the mixed fundamental conditions facing the asset class and the heavy redemption queues that continue to challenge certain funds and frustrate investors who are seeking liquidity.
Performance and Fundamentals
Core real estate returns, as represented by the NFI-ODCE Index, have now had three quarters of positive total return and two quarters of positive appreciation (4Q’24 and 1Q’25) after nine consecutive quarters of negative appreciation going back to mid-2022. While fundamental conditions remain mixed, we have likely seen the bottoming of write-downs created by the rising interest rate environment. Office remains a challenge from a performance standpoint and was the only main property type that was negative in 2024 (-7.7%), while retail led the way in returns for the first time in a decade (+5.3%).
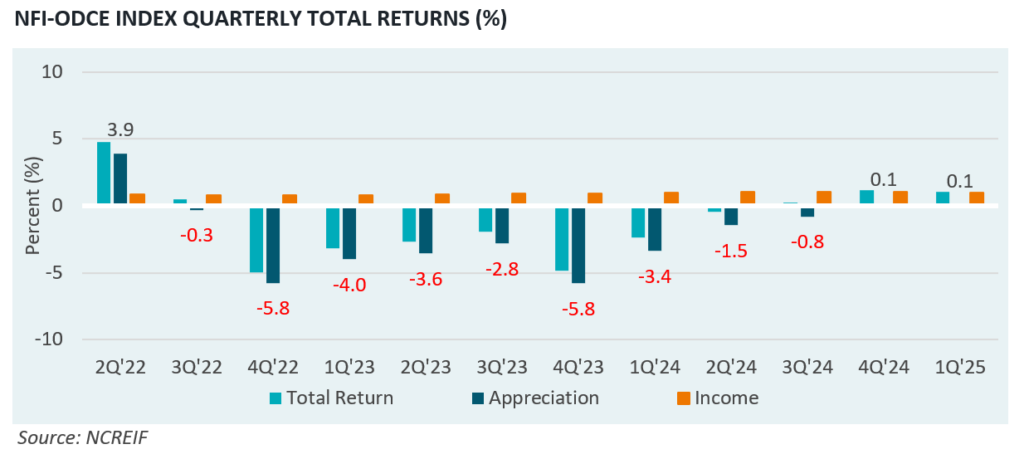
From a fundamental standpoint, office has continued to struggle with growing vacancies and significantly negative net operating income (NOI) growth. Industrial fundamentals have weakened slightly, coming off historical lows in vacancy, while NOI growth has declined to single digits after an extended period of double-digit growth. An increase in new supply has hindered the ability to drive rent increases at the same level as in recent years. Multifamily and retail have had relatively flat changes in vacancy over the last year, although NOI growth has remained positive for both.
From a valuation standpoint, cap rates, which are calculated by dividing a property’s net operating income by its market value, have risen 0.75% to 1.0% for core assets as funds have written down the value of assets. While real estate has been one of the few asset classes that has repriced to the rising rate environment, cap rates have not moved up in lockstep with interest rates as rates have increased 3-4% off their lows. This has led to an environment where cap rate spreads to treasuries remain near historically tight levels, further pressuring valuations. Strong returns would likely need to come from cash flow growth and fundamental improvements rather than cap rate compression as we expect interest rates to settle above their prior lows.
Redemption Queues and Liquidity
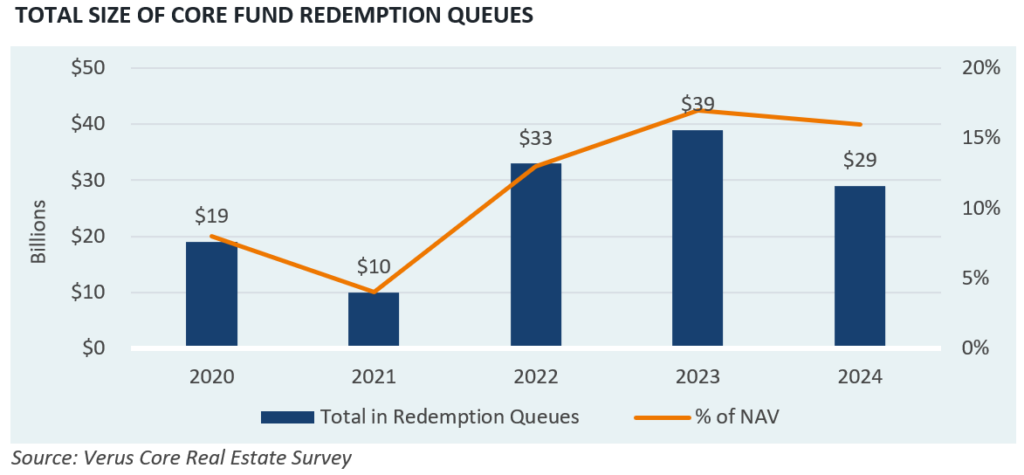
One of the industry’s biggest challenges is the continued high volume of redemption requests hobbling many funds. The current total redemption queue is over $29 billion, with an average of 16% of fund net asset value (NAVs) outstanding. The total is down only slightly from a year earlier when redemption queues averaged 17% of NAVs.
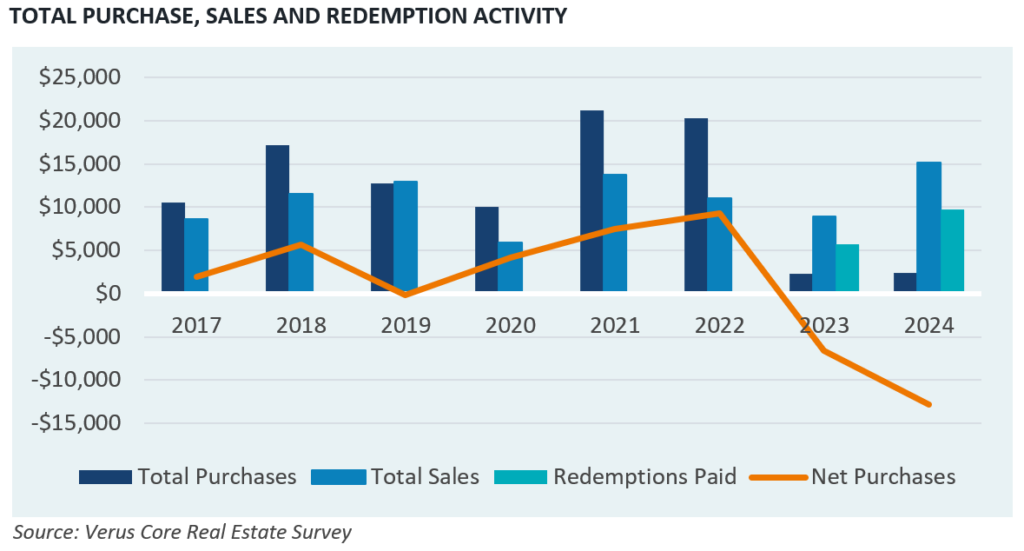
Redemption payments have been frustratingly sluggish as transaction activity slowed across the market. In 2023, total asset sales were less than $9 billion, which was only 27% of the total outstanding queues. In 2024, total asset sales increased to $15 billion, which was still less than 40% of the total outstanding queues. Additionally, in many cases, proceeds from asset sales have not been used to satisfy redemption requests. Funds have needed to use a portion of the proceeds to reduce leverage and pay increasing fund level insurance costs, debt costs and labor/materials. Funds with redemption queues also have the necessity to acquire new assets and managers have looked to balance the needs of investor redemption requests with the Fiduciary responsibility of maximizing returns in their existing portfolios. These two goals are not always harmonious and have led to investors looking for liquidity in a timelier manner frustrated. The painfully slow appraisal process has exacerbated this frustration as it has taken several years for appraisers to fully adjust to new valuations, leading to wide bid-ask spreads and muted transaction levels.
Individual funds with smaller redemption queues have had the ability to be more flexible in purchasing assets and managing optimal asset mixes within their portfolios. It is fair to say that on a go-forward basis, funds with smaller redemption queues will have more flexibility to play offense than those with large queues. This results in a competitive advantage for those funds as more recent transactions exhibit better entry valuations and less competition.
In dialogue with core fund managers, many are expecting a high level of recissions of redemption requests to occur now that returns have turned positive, helping to ease the burdens caused by the queues. While this may or may not happen, we believe that recission levels will likely not occur at the same rates that we saw post-Global Financial Crisis when redemption queues turned into investment queues within a couple of quarters. A moderated recovery projection, availability of sector funds/alternative property types as well as an attractive environment for non-core real estate and real estate debt funds all will provide competition for redeployment of traditional core ODCE fund capital.
Property Type Allocations
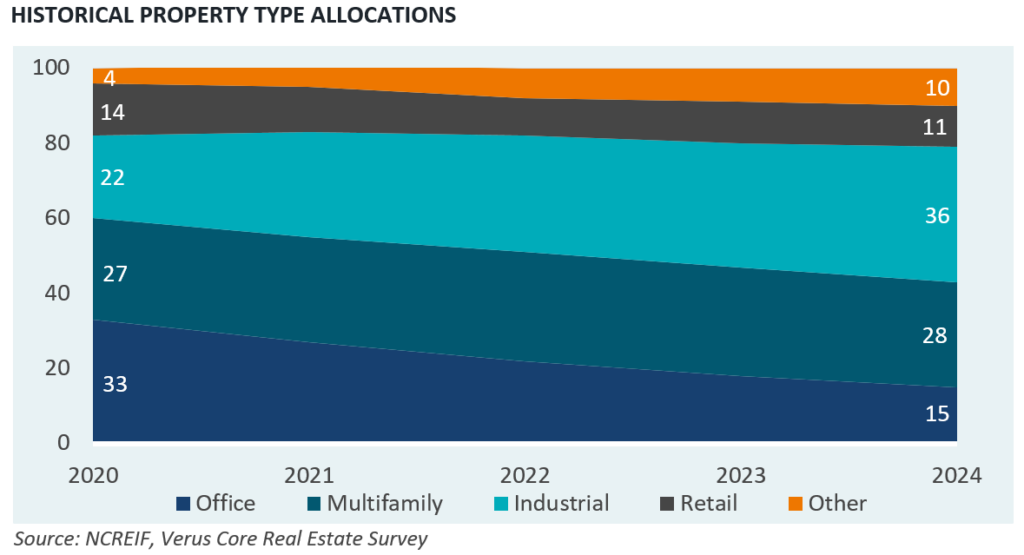
Another important trend observed within our survey data has been the shifting property type allocations seen over time. Over the last four years, there have been significant property type shifts, namely the following:
- Decrease in office exposure – Office exposure has declined from 33% in 2020 to 15% in 2024. Much of this has been driven by write-downs in valuations as the average peak to trough valuation has been -43% across the fund universe. Additionally, funds have been looking to sell office assets where they can, as the sector has been broadly out of favor.
- Increase in Industrial – Industrial exposure has seen the biggest increases in exposures over the last four years as the average exposures have climbed from 22% in 2020 to 36% in 2024 and has grown from the 3rd largest property type allocation in the fund set to the largest.
- Increase in alternative property types – This area has been a growing area of interest for many core funds. In 2020, the total exposure to alternative property sectors was only 4% and has since grown to 10% in 2024. These alternative property sectors include self-storage, data centers, senior housing, student housing, single-family homes, life science, and hospitality. A few years ago, most funds may have had exposures to one or two alternative sectors, while now it is much more common for funds to have small exposures to three to five different alternative sectors.
In 2024, the NCREIF ODCE Index updated its property type inclusion criteria to allow for a broader range of property sectors beyond the traditional “core” real estate categories of office, retail, industrial and multifamily. The new inclusion criteria require at least 75% of fund exposures to come from these core categories, with no more than 25% within these core sectors to come from alternative sub-types such as student housing, manufactured housing, single-family rentals and life science. Additionally, funds are allowed to have a maximum of 25% additional exposure from alternative property types such as self-storage, data centers, senior housing, land and hospitality. We believe these criteria modernize the opportunity set for core funds and expect allocations to continue to increase over time.
One concern is that, given the increases in demand for industrial and multifamily, some funds may face potential concentration issues. We see that approximately one-third of funds are now comprised of at least 70% exposure to those two sectors, which are arguably the most expensive sectors from a cap rate perspective.
Leverage Levels and Cost of Debt
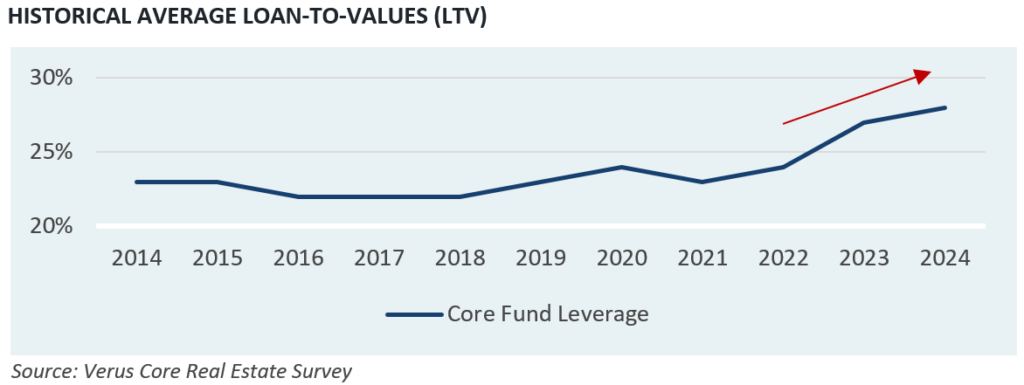
NCREIF requires core funds to maintain fund level leverage below 35% to be included in the NFI-ODCE Index. This was reduced from a maximum of 40% in early 2019. Over the last decade (prior to 2022), the peer-set average leverage hovered within a tight range of 22% to 24%. Since 2022, the average leverage level has risen to 27% at the end of 2023 and 28% at the end of 2024. Much of this has been driven by the denominator effect of asset write-downs.
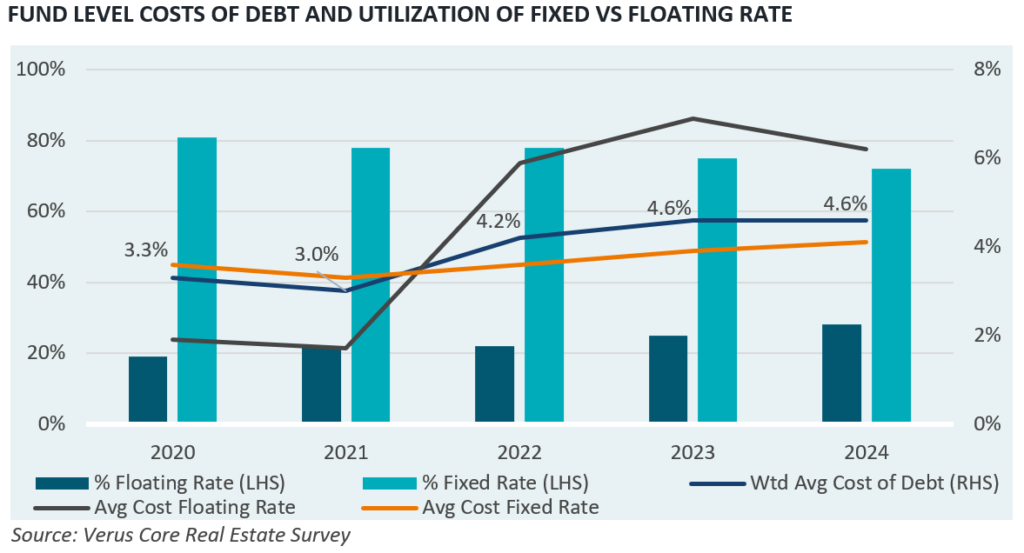
Another trend observed in connection with the overall higher debt levels within the universe is the increase in the weighted average cost of debt. The weighted average cost of debt remained flat over the last 12 months at 4.6%. This is well above the cost of debt from just a few years ago when average rates were closer to 3.0%. As debt maturities roll off, we expect these figures to climb higher as older loans are replaced with newer, more expensive debt. Fund managers have also shifted the mix of debt types across the fund complex between fixed-rate and floating-rate from an 80/20 split in 2020 to a 70/30 split in 2024. This is significant as floating rate loans tend to be more volatile and have become more expensive than fixed rate loans.
Summary
Returns have turned slightly positive for the core real estate asset class, although we are not expecting a V-shaped recovery this time around, as cap rate spreads remain tight. Many funds are facing a number of challenges, including high redemption queues, higher leverage levels, and higher portfolio costs, hampering funds’ abilities to optimally manage portfolios and forcing many to be net sellers in a market that will favor those with capital to spend. Redemption payments have been slow given an overall muted transaction environment over the last several years. Property type allocations have been shifting across the fund complex as funds have reduced office and retail positions in lieu of growing industrial, multifamily and alternative property type exposures.
Investors should use this time as an opportunity to evaluate their core fund exposures. These evaluations should focus on funds with lower redemption queues and lower legacy office exposures, especially avoiding older vintage assets with high vacancy rates. Additionally, we would exercise caution with funds that may have become overly concentrated in industrial and multifamily where assets may appear expensive and favor funds that have existing built-out exposures to a diversified mix of alternative property types.
Disclosures
Past performance is no guarantee of future results. This report or presentation is provided for informational purposes only and is directed to institutional clients and eligible institutional counterparties only and should not be relied upon by retail investors. Nothing herein constitutes investment, legal, accounting or tax advice, or a recommendation to buy, sell or hold a security or pursue a particular investment vehicle or any trading strategy. The opinions and information expressed are current as of the date provided or cited only and are subject to change without notice. This information is obtained from sources deemed reliable, but there is no representation or warranty as to its accuracy, completeness or reliability. This report or presentation cannot be used by the recipient for advertising or sales promotion purposes.
The material may include estimates, outlooks, projections and other “forward-looking statements.” Such statements can be identified by the use of terminology such as “believes,” “expects,” “may,” “will,” “should,” “anticipates,” or the negative of any of the foregoing or comparable terminology, or by discussion of strategy, or assumptions such as economic conditions underlying other statements. No assurance can be given that future results described or implied by any forward looking information will be achieved. Actual events may differ significantly from those presented. Investing entails risks, including possible loss of principal. Risk controls and models do not promise any level of performance or guarantee against loss of principal.